我有一个DataFrame,其中索引不是时间。 我需要将所有旧索引的值重新调整到一个新索引上,这个新索引具有不同的极限和等距间隔。
列中的第一个和最后一个值应该保持不变(虽然它们将被赋予新的、伸展的索引值)。
示例代码如下:
import numpy as np
import pandas as pd
%matplotlib inline
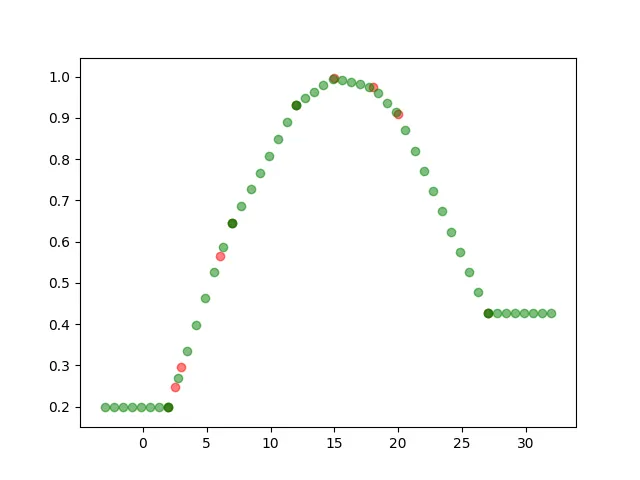
index = np.asarray((2, 2.5, 3, 6, 7, 12, 15, 18, 20, 27))
x = np.sin(index / 10)
df = pd.DataFrame(x, index=index)
df.plot();
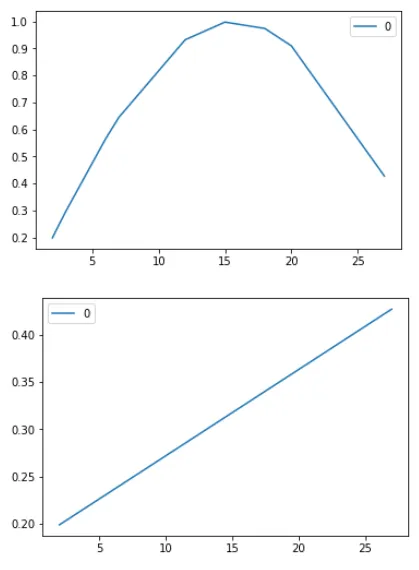
newindex = np.linspace(0, 29, 100)
如何创建一个DataFrame,其中索引为
newindex,新的x值从旧的x值插值得到?第一个新的
x值应与第一个旧的x值相同。最后一个x值也是如此。也就是说,在开头不应该有NaN,在结尾重复最后一个旧x。其他值应该插值以适应新的等间隔索引。
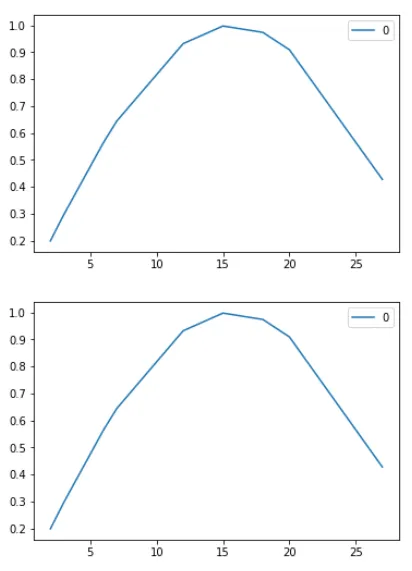
我尝试过
df.interpolate(),但无法解决如何针对newindex进行插值的问题。感谢您提前的帮助。