绘制方向字段

17

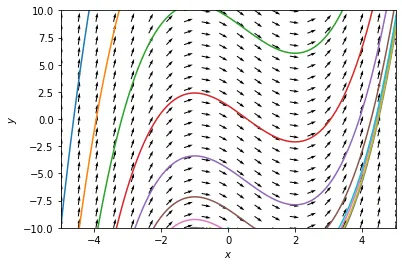
有没有一种方法可以用Python绘制方向场?

我的尝试是修改http://www.compdigitec.com/labs/files/slopefields.py

#!/usr/bin/python

import math
from subprocess import CalledProcessError, call, check_call

def dy_dx(x, y):
    try:
        # declare your dy/dx here:
        return x**2-x-2
    except ZeroDivisionError:
        return 1000.0

# Adjust window parameters
XMIN = -5.0
XMAX = 5.0
YMIN = -10.0
YMAX = 10.0
XSCL = 0.5
YSCL = 0.5

DISTANCE = 0.1

def main():
    fileobj = open("data.txt", "w")
    for x1 in xrange(int(XMIN / XSCL), int(XMAX / XSCL)):
        for y1 in xrange(int(YMIN / YSCL), int(YMAX / YSCL)):
            x= float(x1 * XSCL)
            y= float(y1 * YSCL)
            slope = dy_dx(x,y)
            dx = math.sqrt( DISTANCE/( 1+math.pow(slope,2) ) )
            dy = slope*dx
            fileobj.write(str(x) + " " + str(y) + " " + str(dx) + " " + str(dy) + "\n")
    fileobj.close()


    try:
        check_call(["gnuplot","-e","set terminal png size 800,600 enhanced font \"Arial,12\"; set xrange [" + str(XMIN) + ":" + str(XMAX) + "]; set yrange [" + str(YMIN) + ":" + str(YMAX) + "]; set output 'output.png'; plot 'data.txt' using 1:2:3:4 with vectors"])
    except (CalledProcessError, OSError):
        print "Error: gnuplot not found on system!"
        exit(1)
    print "Saved image to output.png"
    call(["xdg-open","output.png"])
    return 0

if __name__ == '__main__':
    main()
然而,我从中得到的最好印象是。 enter image description here 
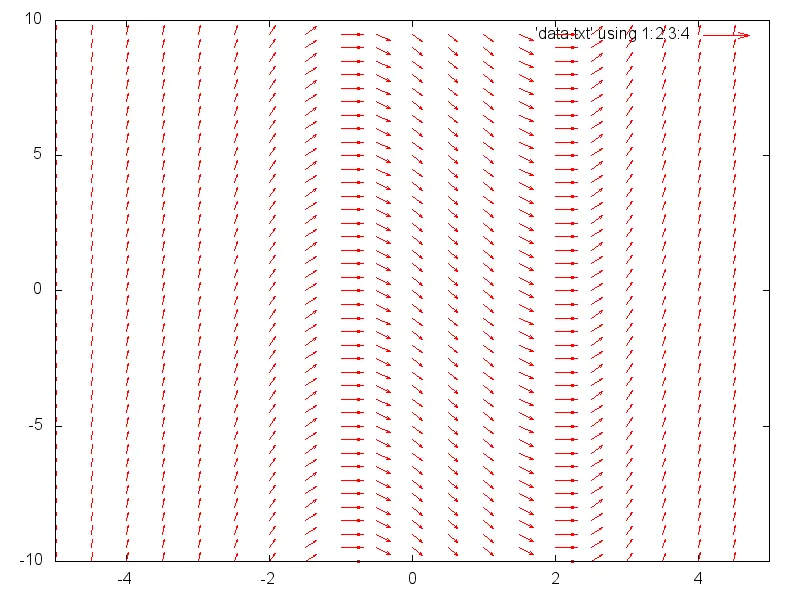
如何获得更像第一张图片的输出?另外,如何添加三条实线?

是的,在matplotlib的帮助下 - fjarri
是的!我实际上制作了一个程序来完成这个任务...回家后会尝试找到它并上传。结果得到了一些非常漂亮的图片。 - Claudiu
斜率场,又称方向场。 - TooTone
3个回答

18
您可以使用此matplotlib代码作为基础。根据您的需要进行修改。 我已更新代码以显示相同长度的箭头。重要选项是设置quiver函数的angles选项,以便正确打印箭头从(x,y)到(x+u,y+v)(而不是默认情况下仅在计算角度时考虑(u,v))。 还可以将轴从“方框”更改为“箭头”。如果您需要更改,请告诉我,我可以添加它。
import matplotlib.pyplot as plt
from scipy.integrate import odeint
import numpy as np

fig = plt.figure()

def vf(x, t):
    dx = np.zeros(2)
    dx[0] = 1.0
    dx[1] = x[0] ** 2 - x[0] - 2.0
    return dx


# Solution curves
t0 = 0.0
tEnd = 10.0

# Vector field
X, Y = np.meshgrid(np.linspace(-5, 5, 20), np.linspace(-10, 10, 20))
U = 1.0
V = X ** 2 - X - 2
# Normalize arrows
N = np.sqrt(U ** 2 + V ** 2)
U = U / N
V = V / N
plt.quiver(X, Y, U, V, angles="xy")

t = np.linspace(t0, tEnd, 100)
for y0 in np.linspace(-5.0, 0.0, 10):
    y_initial = [y0, -10.0]
    y = odeint(vf, y_initial, t)
    plt.plot(y[:, 0], y[:, 1], "-")

plt.xlim([-5, 5])
plt.ylim([-10, 10])
plt.xlabel(r"$x$")
plt.ylabel(r"$y$")

The slope field


如何为这些彩色曲线获取参数化? - Sigur
为什么 U=1?假设我有 dy_dt = -3y+t+e**(-2*t),U 还是 1 吗? - Ricardo Acuna
1
@RicardoAcuna 程序中的 U,V 公式专门用于箭头,且与 vf(矢量场)函数的方程完全相同。因此,如果您想绘制类似的图片,请将 $(U,V)=(f_1(X,Y),f_2(X,Y))$ 写成 $(x',y')=(f_1(x,y),f_2(x,y))$。请注意,我使用大写的 $(X,Y)$ 表示网格的坐标。然后,您可以使用 $N$ 来规范化箭头的长度,以便它们都具有相同的长度。因此,重要的是要注意,您得到的图片只描述了一个被规范化的矢量场的方向,而不是速度本身。希望这能帮到您。 - PepeToro
在你的vf函数中,dx保存[dx/dx, dy/dx]对吧?所以对于所有微分方程,dx[0] = 1,而dx[1] = x[0]**2 + 1,如果(dy/dx = x^2 + 1)。如果(dy/dx = x^2 + y + 1),那么dx[1] = x[0]**2 + y[0] + 1,对吗? - Aditya P
1
这个脚本是错误的,因为 quiver 绘制箭头角度的方式不对。默认设置是 angles="uv",这使得角度只取决于 u 和 v。可以通过 angles="xy" 来获得正确的图形,这样箭头从 (x,y) 到 (x+u,y+u)。 - Michael Baudin
显示剩余2条评论

2
我很享受用pygame做这个爱好项目,我在每个像素上绘制了斜率,使用蓝色的阴影表示正值,使用红色的阴影表示负值。黑色代表未定义。这是dy/dx = log(sin(x/y)+cos(y/x)):

dy/dx=log(sin(x/y)+cos(y/x)

您可以放大和缩小 - 这里是放大了中上部分:

as above zoomed in

并且还可以点击一个点以绘制通过该点的线:

and as it is such so also as such is it unto you

只有440行代码,所以这里是所有文件的.zip文件。我想在这里摘录相关的部分。
方程本身被输入为有效的Python表达式字符串,例如"log(sin(x/y)+cos(y/x))"。然后进行compile。这个函数绘制颜色场,其中self.func.eval()给出了给定点的dy/dx。这里的代码有点复杂,因为我让它分阶段渲染——首先是32x32块,然后是16x16等等——以使用户更快地使用。
def graphcolorfield(self, sqsizes=[32,16,8,4,2,1]):
    su = ScreenUpdater(50)
    lastskip = self.xscreensize
    quitit = False
    for squaresize in sqsizes:
        xsquaresize = squaresize
        ysquaresize = squaresize

        if squaresize == 1:
            self.screen.lock()
        y = 0
        while y <= self.yscreensize:
            x = 0
            skiprow = y%lastskip == 0
            while x <= self.xscreensize:
                if skiprow and x%lastskip==0:
                    x += squaresize
                    continue

                color = (255,255,255)
                try:
                    m = self.func.eval(*self.ct.untranscoord(x, y))
                    if m >= 0:
                        if m < 1:
                            c = 255 * m
                            color = (0, 0, c)
                        else:
                            #c = 255 - 255 * (1.0/m)
                            #color = (c, c, 255)
                            c = 255 - 255 * (1.0/m)
                            color = (c/2.0, c/2.0, 255)

                    else:
                        pm = -m
                        if pm < 1:
                            c = 255 * pm
                            color = (c, 0, 0)
                        else:
                            c = 255 - 255 * (1.0/pm)
                            color = (255, c/2.0, c/2.0)                        
                except:
                    color = (0, 0, 0)

                if squaresize > 1:
                    self.screen.fill(color, (x, y, squaresize, squaresize))
                else:
                    self.screen.set_at((x, y), color)

                if su.update():
                    quitit = True
                    break

                x += xsquaresize

            if quitit:
                break

            y += ysquaresize

        if squaresize == 1:
            self.screen.unlock()
        lastskip = squaresize
        if quitit:
            break

这是通过一个点绘制直线的代码:
def _grapheqhelp(self, sx, sy, stepsize, numsteps, color):
    x = sx
    y = sy
    i = 0

    pygame.draw.line(self.screen, color, (x, y), (x, y), 2)
    while i < numsteps:
        lastx = x
        lasty = y

        try:
            m = self.func.eval(x, y)
        except:
            return

        x += stepsize            
        y = y + m * stepsize

        screenx1, screeny1 = self.ct.transcoord(lastx, lasty)
        screenx2, screeny2 = self.ct.transcoord(x, y)

        #print "(%f, %f)-(%f, %f)" % (screenx1, screeny1, screenx2, screeny2)

        try:
            pygame.draw.line(self.screen, color,
                             (screenx1, screeny1),
                             (screenx2, screeny2), 2)
        except:
            return

        i += 1

    stx, sty = self.ct.transcoord(sx, sy)
    pygame.draw.circle(self.screen, color, (int(stx), int(sty)), 3, 0)

它从那个点开始向前和向后运行:
def graphequation(self, sx, sy, stepsize=.01, color=(255, 255, 127)):
    """Graph the differential equation, given the starting point sx and sy, for length
    length using stepsize stepsize."""
    numstepsf = (self.xrange[1] - sx) / stepsize
    numstepsb = (sx - self.xrange[0]) / stepsize

    self._grapheqhelp(sx, sy,  stepsize, numstepsf, color)
    self._grapheqhelp(sx, sy, -stepsize, numstepsb, color)

我从来没有画出实际的线条,因为像素方法看起来太酷了。

0

尝试将参数的值更改为以下内容:

XSCL = .2
YSCL = .2

这些参数决定在坐标轴上采样多少点。


根据您的评论,您还需要绘制适用于导数dy_dx(x, y)的函数。
目前,您只计算和绘制了由函数dy_dx(x,y)计算出的斜率线。除斜率外,您需要找到(在此情况下为3个)要绘制的函数。
首先定义一个函数:
def f1_x(x):
    return x**3-x**2-2x;

然后,在您的循环中,您还需要将函数的期望值写入到fileobj文件中。


谢谢。0.5看起来大致正确。但是对我来说仍然不够好(例如没有坐标轴),但不管怎样,你知道如何添加这三条实线吗?如果可能的话,我的偏好是在Python中完成整个过程,而不使用gnuplot。 - Simd

网页内容由stack overflow 提供, 点击上面的
可以查看英文原文,
原文链接