我正在尝试实现与Matlab中此功能相同的行为,即每个箭头的颜色均对应其大小和方向,基本上从一个色轮中绘制其颜色。我看到了这个问题,但它似乎只适用于barbs。我还看到了这篇答案,但是quiver抱怨颜色数组必须是二维的。
计算C以考虑大小和方向的最佳方法是什么,用于matplotlib.pyplot.quiver?
我正在尝试实现与Matlab中此功能相同的行为,即每个箭头的颜色均对应其大小和方向,基本上从一个色轮中绘制其颜色。我看到了这个问题,但它似乎只适用于barbs。我还看到了这篇答案,但是quiver抱怨颜色数组必须是二维的。
计算C以考虑大小和方向的最佳方法是什么,用于matplotlib.pyplot.quiver?
import numpy as np
import matplotlib.colors
import matplotlib.pyplot as plt
def vector_to_rgb(angle, absolute):
"""Get the rgb value for the given `angle` and the `absolute` value
Parameters
----------
angle : float
The angle in radians
absolute : float
The absolute value of the gradient
Returns
-------
array_like
The rgb value as a tuple with values [0..1]
"""
global max_abs
# normalize angle
angle = angle % (2 * np.pi)
if angle < 0:
angle += 2 * np.pi
return matplotlib.colors.hsv_to_rgb((angle / 2 / np.pi,
absolute / max_abs,
absolute / max_abs))
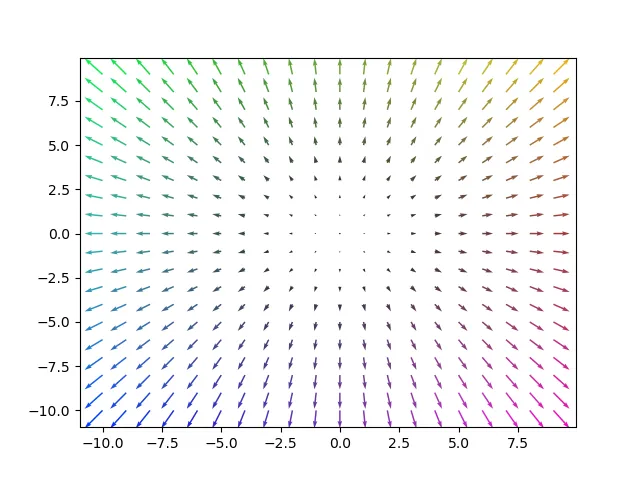
X = np.arange(-10, 10, 1)
Y = np.arange(-10, 10, 1)
U, V = np.meshgrid(X, Y)
angles = np.arctan2(V, U)
lengths = np.sqrt(np.square(U) + np.square(V))
max_abs = np.max(lengths)
c = np.array(list(map(vector_to_rgb, angles.flatten(), lengths.flatten())))
fig, ax = plt.subplots()
q = ax.quiver(X, Y, U, V, color=c)
plt.show()
编辑
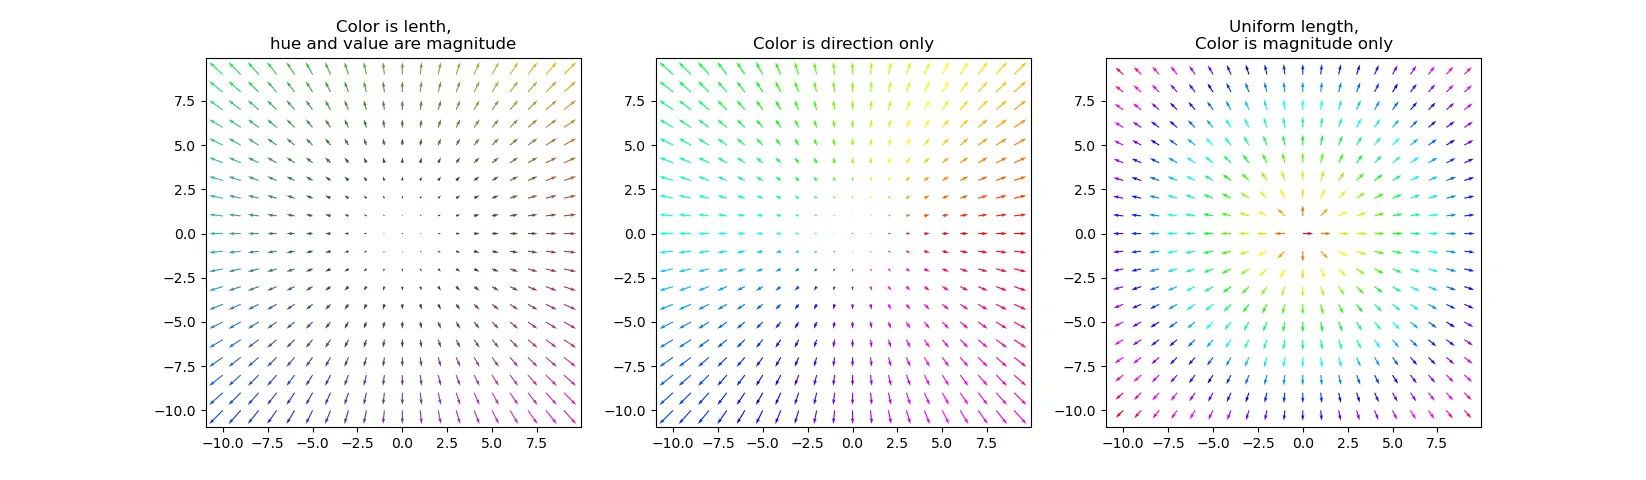
我刚刚注意到,链接的Matlab函数“将矢量场呈网格状的单位长度箭头。箭头方向表示矢量场方向,颜色表示大小”。所以我上面的示例并不是问题中的内容。以下是一些修改。
左图与上图相同。右图执行引用的Matlab函数:颜色表示大小的单位长度箭头图。中间的图仅使用方向而不是大小来表示颜色,这也可能很有用。我希望其他组合从这个示例中也很清楚。
import numpy as np
import matplotlib.colors
import matplotlib.pyplot as plt

def vector_to_rgb(angle, absolute):
    """Get the rgb value for the given `angle` and the `absolute` value

    Parameters
    ----------
    angle : float
        The angle in radians
    absolute : float
        The absolute value of the gradient

    Returns
    -------
    array_like
        The rgb value as a tuple with values [0..1]
    """
    global max_abs

    # normalize angle
    angle = angle % (2 * np.pi)
    if angle < 0:
        angle += 2 * np.pi

    return matplotlib.colors.hsv_to_rgb((angle / 2 / np.pi,
                                         absolute / max_abs,
                                         absolute / max_abs))

X = np.arange(-10, 10, 1)
Y = np.arange(-10, 10, 1)
U, V = np.meshgrid(X, Y)

angles = np.arctan2(V, U)
lengths = np.sqrt(np.square(U) + np.square(V))
max_abs = np.max(lengths)

# color is direction, hue and value are magnitude
c1 = np.array(list(map(vector_to_rgb, angles.flatten(), lengths.flatten())))

ax = plt.subplot(131)
ax.set_title("Color is lenth,\nhue and value are magnitude")
q = ax.quiver(X, Y, U, V, color=c1)

# color is length only
c2 = np.array(list(map(vector_to_rgb, angles.flatten(),
                                      np.ones_like(lengths.flatten()) * max_abs)))

ax = plt.subplot(132)
ax.set_title("Color is direction only")
q = ax.quiver(X, Y, U, V, color=c2)

# color is direction only
c3 = np.array(list(map(vector_to_rgb, 2 * np.pi * lengths.flatten() / max_abs,
                                      max_abs * np.ones_like(lengths.flatten()))))

# create one-length vectors
U_ddash = np.ones_like(U)
V_ddash = np.zeros_like(V)
# now rotate them
U_dash = U_ddash * np.cos(angles) - V_ddash * np.sin(angles)
V_dash = U_ddash * np.sin(angles) + V_ddash * np.cos(angles)

ax = plt.subplot(133)
ax.set_title("Uniform length,\nColor is magnitude only")
q = ax.quiver(X, Y, U_dash, V_dash, color=c3)

plt.show()
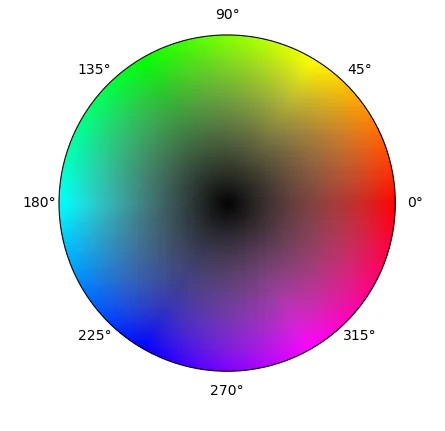
max_abs值,它是颜色色相和亮度可以达到的最大值。在这里也再次重复使用了vector_to_rgb()函数。ax = plt.subplot(236, projection='polar')
n = 200
t = np.linspace(0, 2 * np.pi, n)
r = np.linspace(0, max_abs, n)
rg, tg = np.meshgrid(r, t)
c = np.array(list(map(vector_to_rgb, tg.T.flatten(), rg.T.flatten())))
cv = c.reshape((n, n, 3))
m = ax.pcolormesh(t, r, cv[:,:,1], color=c, shading='auto')
m.set_array(None)
ax.set_yticklabels([])