我正在使用Matplotlib中的Quiver绘制矢量场。我想根据产生特定箭头的数据数量来更改每个箭头的线条粗细。因此,我需要的不是箭头大小的通用比例变换,而是逐个自定义Quiver箭头线条粗细的方法。是否可行?你能帮我吗?
2个回答
13
linewidths参数用于控制plt.quiver中箭头的粗细。如果你传递给它一个一维数组的值,每个箭头都会有不同的粗细。
例如:
widths = np.linspace(0, 2, X.size)
plt.quiver(X, Y, cos(deg), sin(deg), linewidths=widths)
import matplotlib.pyplot as plt
import numpy as np
sin = np.sin
cos = np.cos
# https://dev59.com/lVjUa4cB1Zd3GeqPQE6N
xmax = 4.0
xmin = -xmax
D = 20
ymax = 4.0
ymin = -ymax
x = np.linspace(xmin, xmax, D)
y = np.linspace(ymin, ymax, D)
X, Y = np.meshgrid(x, y)
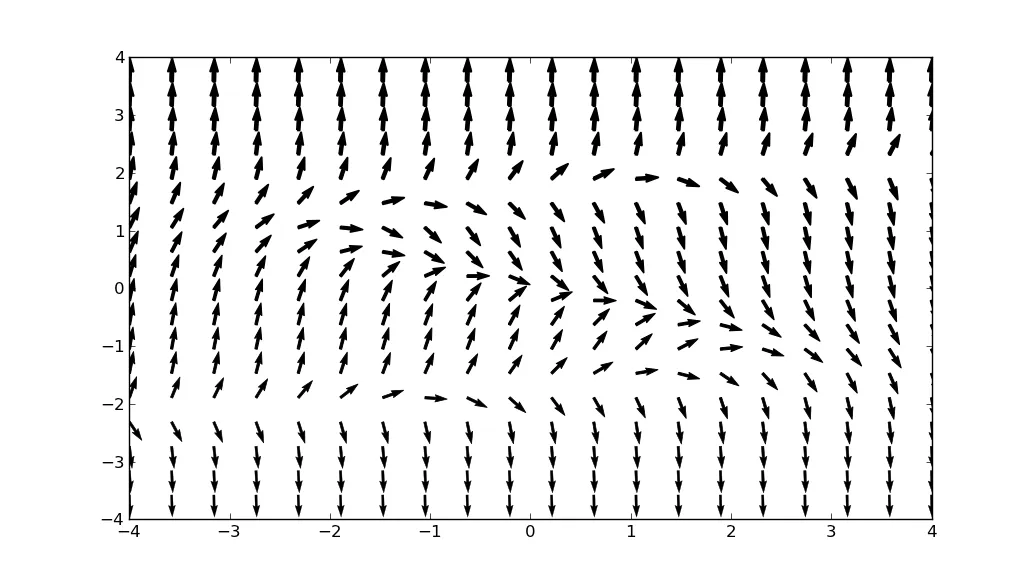
# plots the vector field for Y'=Y**3-3*Y-X
deg = np.arctan(Y ** 3 - 3 * Y - X)
widths = np.linspace(0, 2, X.size)
plt.quiver(X, Y, cos(deg), sin(deg), linewidths=widths)
plt.show()
- unutbu
2
5
@unutbu的方法在Matplotlib 2.0.0之后已经不再适用(参见这个问题和这个pull request)。截至Matplotlib 2.1.2,似乎没有plt.quiver的官方支持单独配置箭头宽度的参数。但是仍然有一些解决方法可供使用。
方法1
只需使用Python的循环和width参数即可。对于大量数据,这将会很慢。
import matplotlib.pyplot as plt
import numpy as np

# original code by user423805
# https://dev59.com/lVjUa4cB1Zd3GeqPQE6N#6372413
xmax = 4.0
xmin = -xmax
D = 20
ymax = 4.0
ymin = -ymax

for y in np.linspace(ymin, ymax, D):
    for x in np.linspace(xmin, xmax, D):
        deg = np.arctan(y ** 3 - 3 * y - x)
        w = 0.005 * (y - ymin) / (ymax - ymin)  # just example...
        plt.quiver(x, y, np.cos(deg), np.sin(deg), width=w)

plt.show()
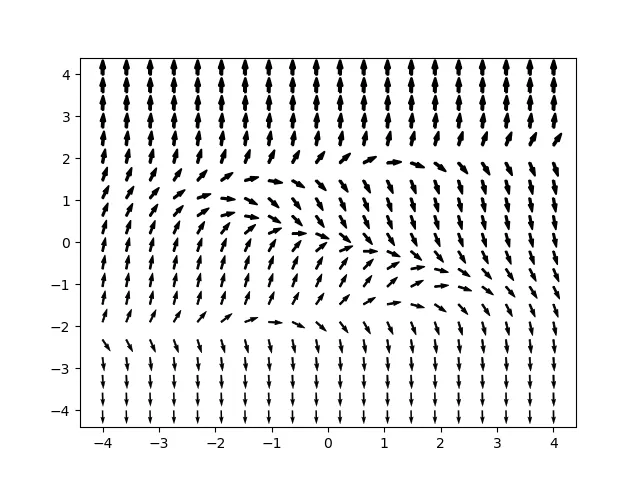
方法二
这只是一个解决方法,但如果我们设置edgecolors,linewidths可以使用。

import matplotlib.pyplot as plt
import numpy as np

# original code by user423805
# https://dev59.com/lVjUa4cB1Zd3GeqPQE6N#6372413
xmax = 4.0
xmin = -xmax
D = 20
ymax = 4.0
ymin = -ymax
x = np.linspace(xmin, xmax, D)
y = np.linspace(ymin, ymax, D)
X, Y = np.meshgrid(x, y)
deg = np.arctan(Y ** 3 - 3 * Y - X)
widths = np.linspace(0, 2, X.size)
plt.quiver(X, Y, np.cos(deg), np.sin(deg), linewidths=widths, edgecolors='k')
plt.show()
请注意,matplotlib维护者之一efiring在此处表示:
因此,请使用
width关键字参数和units;当明确请求使用不同颜色的轮廓线时,linewidths仅用于控制轮廓线条厚度。
- nekketsuuu
网页内容由stack overflow 提供, 点击上面的可以查看英文原文,
原文链接
原文链接
width关键字代替。 - kilojoules