使用R语言进行多项预测的先知预测

5

我对使用R中的Prophet进行时间序列预测非常陌生。我能够使用Prophet预测单个产品的值。是否有办法通过循环使用Prophet为多个产品生成预测?下面的代码对于单个产品完全正常,但我正在尝试为多个产品生成预测。

 library(prophet)
 df <- read.csv("Prophet.csv")
 df$Date<-as.Date(as.character(df$Date), format =  "%d-%m-%Y")
 colnames(df) <- c("ds", "y")
 m <- prophet(df)
 future <- make_future_dataframe(m, periods = 40)
 tail(future)
 forecast <- predict(m, future)
 write.csv(forecast[c('ds','yhat')],"Output_Prophet.csv")
 tail(forecast[c('ds', 'yhat', 'yhat_lower', 'yhat_upper')])

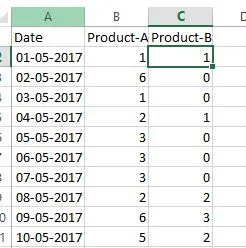
Sample Dataset:

enter image description here


一个 reprex 将帮助我们给出答案。https://reprex.tidyverse.org/articles/reprex-dos-and-donts.html - pedram
1个回答

6
这可以通过使用purrr包中的listsmap函数来完成。
让我们构建一些数据:
library(tidyverse) # contains also the purrr package
set.seed(123)
tb1 <- tibble(
  ds = seq(as.Date("2018-01-01"), as.Date("2018-12-31"), by = "day"),
  y = sample(365)
)
tb2 <- tibble(
  ds = seq(as.Date("2018-01-01"), as.Date("2018-12-31"), by = "day"),
  y = sample(365)
)

ts_list <- list(tb1, tb2) # two separate time series
# using this construct you could add more of course

构建和预测:

library(prophet)

m_list <- map(ts_list, prophet) # prophet call

future_list <- map(m_list, make_future_dataframe, periods = 40) # makes future obs

forecast_list <- map2(m_list, future_list, predict) # map2 because we have two inputs

# we can access everything we need like with any list object
head(forecast_list[[1]]$yhat) # forecasts for time series 1
[1] 179.5214 198.2375 182.7478 173.5096 163.1173 214.7773
head(forecast_list[[2]]$yhat) # forecast for time series 2
[1] 172.5096 155.8796 184.4423 133.0349 169.7688 135.2990

更新(仅输入部分,构建和预测部分相同):

基于OP的请求,我创建了一个新的示例,基本上您需要将所有内容再次放入列表对象中:

# suppose you have a data frame like this:
set.seed(123)
tb1 <- tibble(
  ds = seq(as.Date("2018-01-01"), as.Date("2018-12-31"), by = "day"),
  productA = sample(365),
  productB = sample(365)
)
head(tb1)
# A tibble: 6 x 3
  ds         productA productB
  <date>        <int>    <int>
1 2018-01-01      105      287
2 2018-01-02      287       71
3 2018-01-03      149        7
4 2018-01-04      320      148
5 2018-01-05      340      175
6 2018-01-06       17      152

# with some dplyr and base R you can trasform each time series in a data frame within a list
ts_list <- tb1 %>% 
  gather("type", "y", -ds) %>% 
  split(.$type)
# this just removes the type column that we don't need anymore
ts_list <- lapply(ts_list, function(x) { x["type"] <- NULL; x })
# now you can continue just like above..

抱歉RLave,我在创建循环以调用更多输入方面遇到一些挑战。你能在这里分享代码片段示例吗?我已经在上面贴了一个样本数据集。 - hari babu
1
@hari babu 更新了答案。请注意,您应该始终尝试发布数据示例,而不是图像。 - RLave
你认为这是正确的步骤吗?还是有改进的建议?df <- read.csv("Prophet_2_List.csv") df$Date<-as.Date(as.character(df$Date), format = "%d-%m-%Y") ns <- ncol(df) tb1 <- tibble( ds = df$Date, for (i in 1:ns){ product[i] = df[,i] } ) - hari babu
非常好的回答。我在想如果我们需要处理长度不相等的列表会怎样。具体来说,假设产品B只有50个观测值而不是60个。在这种情况下,您不能使用tbl_df,因为它要求所有列表的长度相等。有什么想法吗?@RLave - small_lebowski
1
只要你使用列表,这不应该是个问题。如果你遇到了一些问题,可以在SO上提出一个特定的新问题。当然,如果你有一个数据框,你不能有两个长度不同的产品,所以你需要遵循我的第一个例子,从两个开始并使用list()函数。 - RLave
显示剩余9条评论

网页内容由stack overflow 提供, 点击上面的
可以查看英文原文,
原文链接