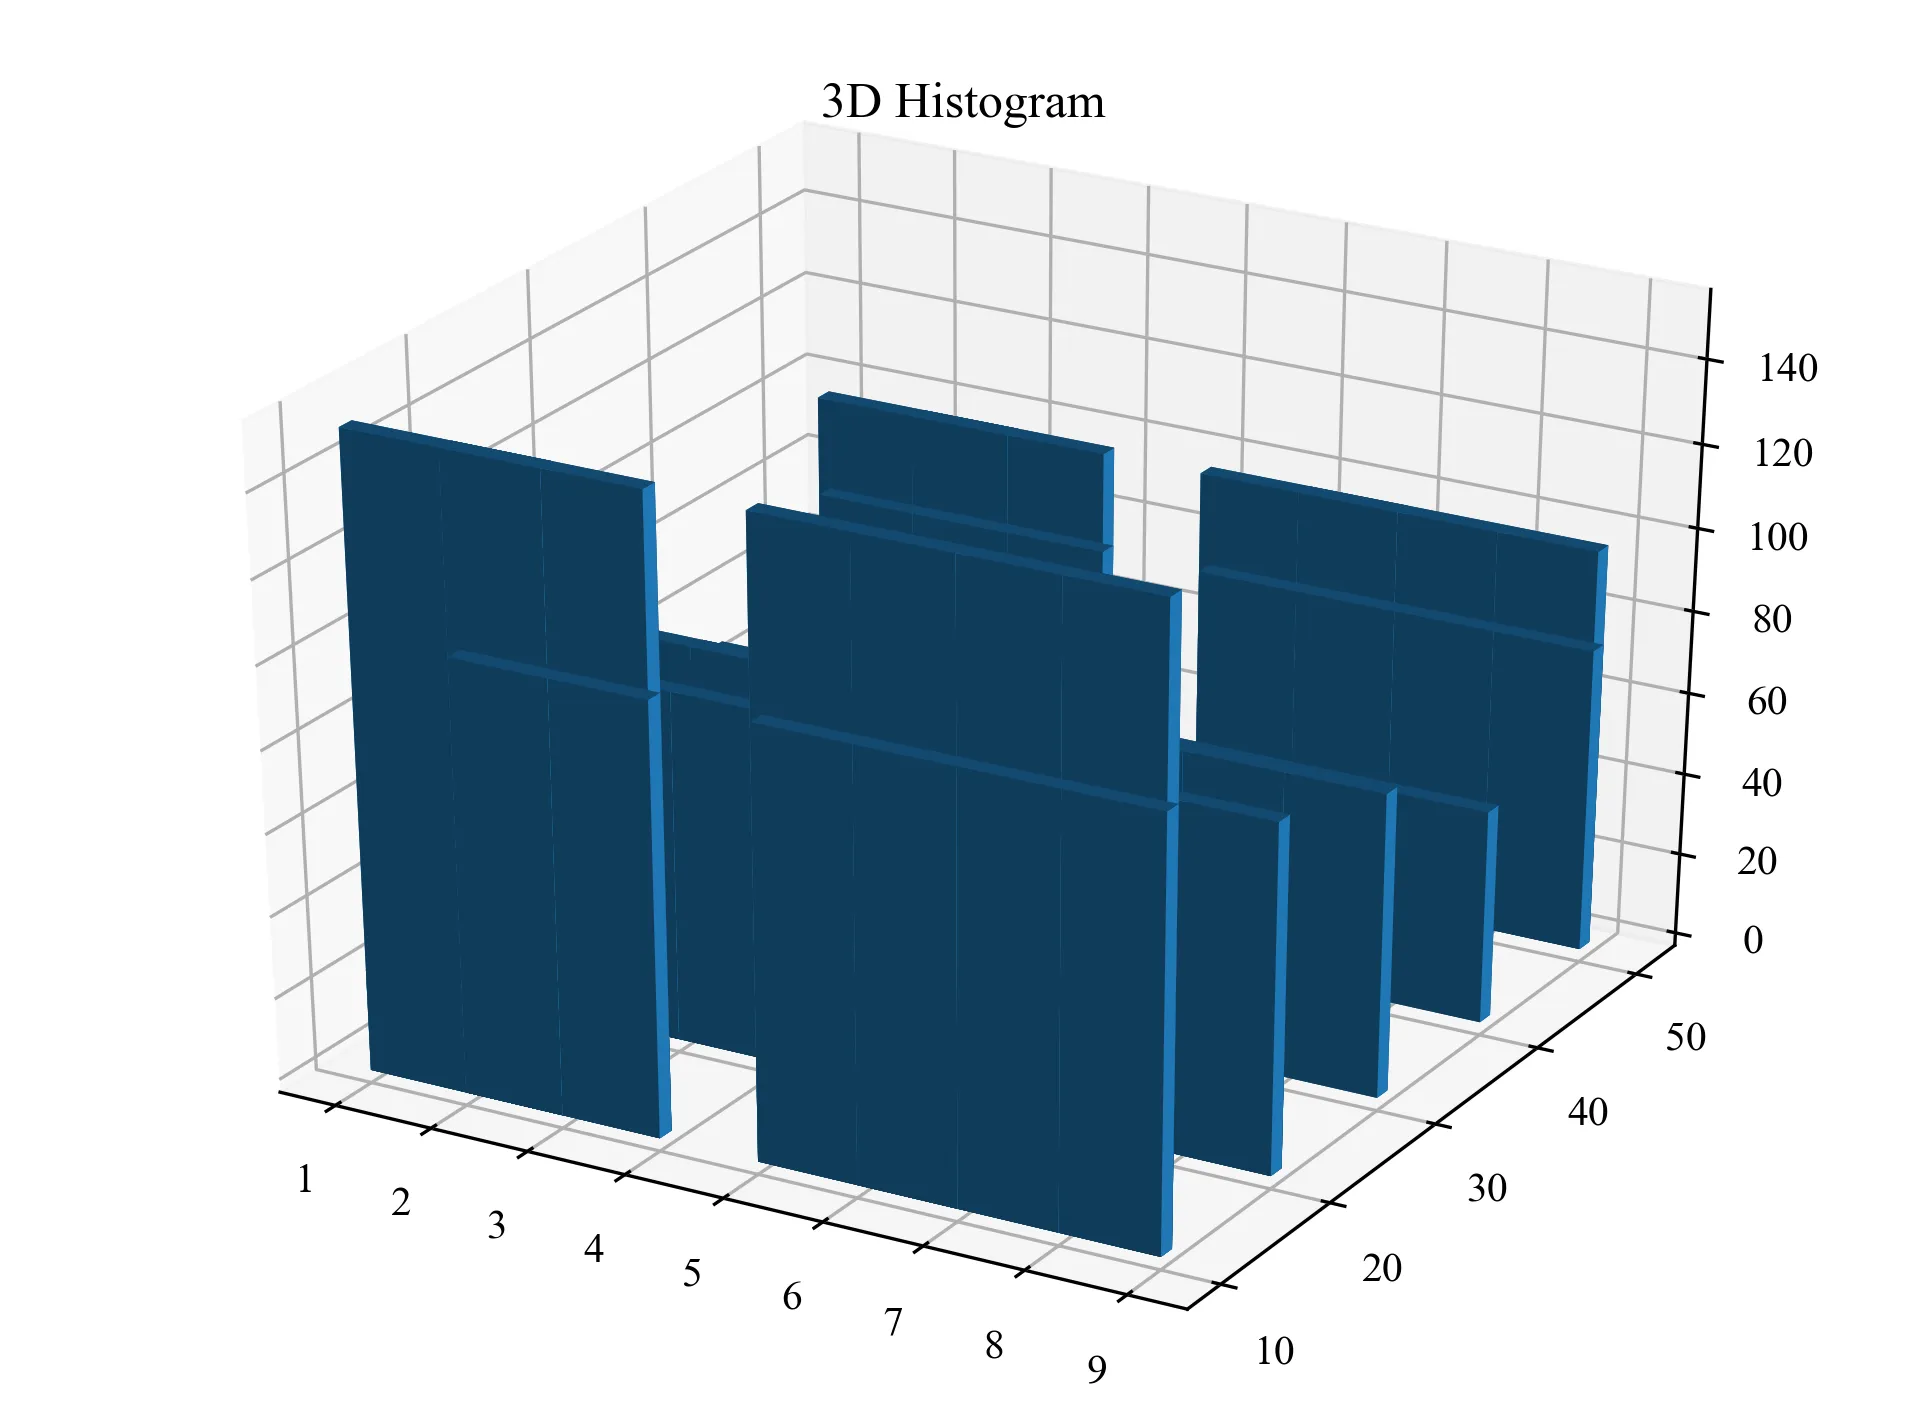
如何绘制3D柱状图

4

我有三个数组,想要制作一个三维直方图。

x = [1, 2, 3, 2, 5, 2, 6, 8, 6, 7]
y = [10, 10, 20, 50, 20, 20, 30, 10, 40, 50, 60]
z = [105, 25, 26, 74, 39, 85, 74, 153, 52, 98]

到目前为止,这是我的尝试:

from mpl_toolkits.mplot3d import Axes3D
import matplotlib.pyplot as plt
import numpy as np
fig = plt.figure()
ax = plt.axes(projection='3d')

binsOne = sorted(set(x))
binsTwo = sorted(set(y))
hist, xedges, yedges = np.histogram2d(x, y, bins=[binsOne, binsTwo])
xpos, ypos = np.meshgrid(xedges[:-1] + 0.25 , yedges[:-1] + 0.25)
xpos = xpos.flatten('F')
ypos = ypos.flatten('F')
zpos = np.zeros_like(xpos)

dx = dx.flatten()
dy = dy.flatten()
dz = hist.flatten()

ax.bar3d(xpos, ypos, zpos, dx, dy, dz, color='b', zsort='average')

我该如何将 z 数组整合到我的三维柱状图中?


我建议您阅读这篇帖子:https://dev59.com/ALDla4cB1Zd3GeqP5ED9 Matplotlib在三维绘图方面存在一些问题,请注意! - Alessandro Peca
1个回答

1

z数组的形状必须与xposypos(它们本身的形状相同)相同,而不是与xy相同。您可能会发现这个示例比您使用的更有用。以下代码演示了第一个链接中的示例应用于您的问题,

from mpl_toolkits.mplot3d import Axes3D
import matplotlib.pyplot as plt
import numpy as np

fig = plt.figure()
ax = fig.add_subplot(111, projection='3d')

_x = [1, 2, 3, 2, 5, 2, 6, 8, 6, 7]
_y = [10, 10, 20, 50, 20, 20, 30, 10, 40, 50]
_xx, _yy = np.meshgrid(_x, _y)
x, y = _xx.ravel(), _yy.ravel()
_z = np.array([105, 25, 26, 74, 39, 85, 74, 153, 52, 98])

# There may be an easier way to do this, but I am not aware of it
z = np.zeros(len(x))
for i in range(1, len(x)):
    z[i] = _z[(i*len(_z)) / len(x)]

bottom = np.zeros_like(z)
width = depth = 1

ax.bar3d(x, y, bottom, width, depth, z, shade=True)
plt.show()

enter image description here


谢谢你的回答,为什么在ax.bar3d中z没有跟随x和y?另外,你能解释一下for循环对_z做了什么吗? - Matt-pow
@Matt-pow,我不明白你的问题。数组中的“z”值决定了条形图的高度,“x”值确定了“x”位置,“y”值确定了“y”位置。对于与共同“z”值对应的“x”和“y”对,您会看到多个条形图。由于条形图“1”在“x”轴上实际上从“1”到“2”,而“8”从“8”到“9”,因此“y”和“x”轴上的值有点令人困惑。 - William Miller
@Matt-pow _zfor 循环将形状为 (10L, ) 的数组 _z 转换为形状为 (100L, ) 的数组 z,其中每个值都有 10 个实例。 - William Miller
1
感谢您的解释。 - Matt-pow

网页内容由stack overflow 提供, 点击上面的
可以查看英文原文,
原文链接