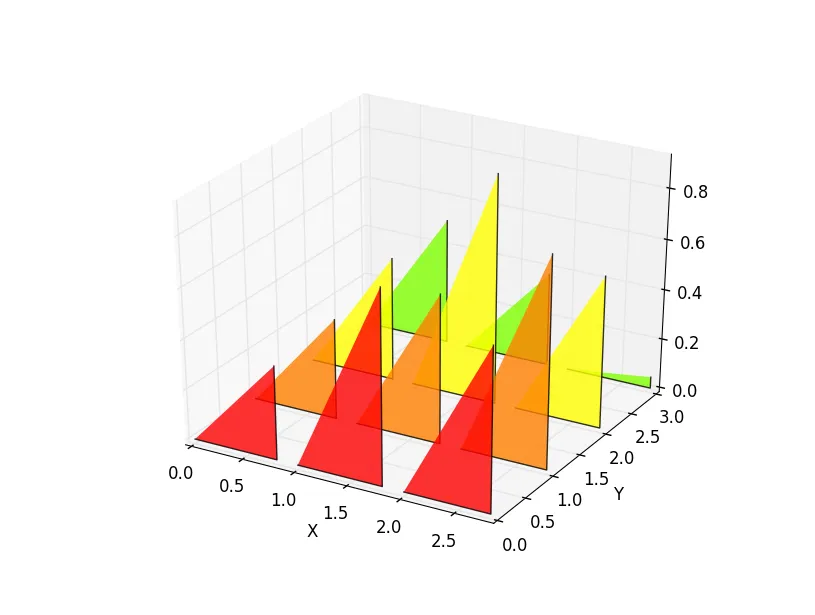
当我用4个或更多值制作3D条形图时,图表看起来正确,但是当我尝试使用3个值时,条形变成了三角形,发生了什么?
from mpl_toolkits.mplot3d import Axes3D
import matplotlib.pyplot as plt
import numpy as np

fig = plt.figure()
ax = fig.add_subplot(111, projection='3d')

color_grade_classes = ['#80FF00','#FFFF00','#FF8000', '#FF0000']

for colors, rows  in zip(color_grade_classes, [3,2,1,0] ):
  indexs = np.arange(3)
  heights = np.random.rand(3)
  print rows, indexs, heights, colors

  ax.bar(indexs, heights, zs = rows,  zdir='y', color=colors, alpha=0.8)

ax.set_xlabel('X')
ax.set_ylabel('Y')

plt.show()
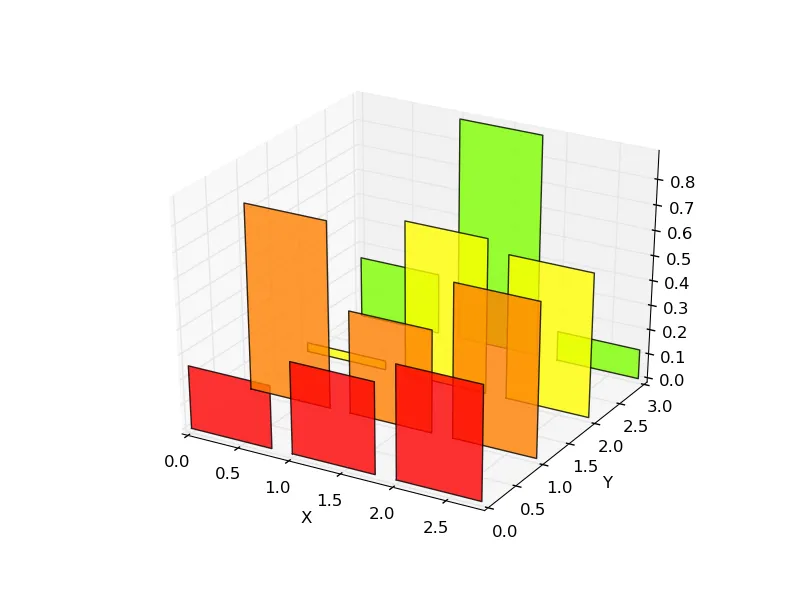
生成这个:
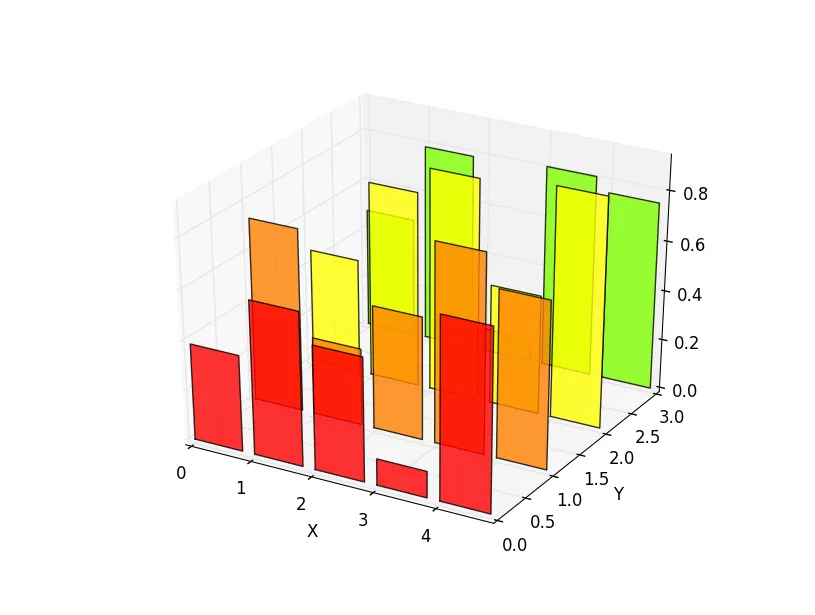
但是当我将索引和高度的数量增加到5时,我会得到这个: