我有一段Python代码,它对wav文件执行FFT并绘制振幅与时间/振幅与频率的图表。我想从这些图表中计算dB值(它们是长数组)。我不想计算精确的dBA,只想在我的计算后看到一个线性关系。我有一个dB仪,我会进行比较。以下是我的代码:
#!/usr/bin/env python
# -*- coding: utf-8 -*-
from __future__ import print_function
import scipy.io.wavfile as wavfile
import scipy
import scipy.fftpack
import numpy as np
from matplotlib import pyplot as plt
fs_rate, signal = wavfile.read("output.wav")
print ("Frequency sampling", fs_rate)
l_audio = len(signal.shape)
print ("Channels", l_audio)
if l_audio == 2:
signal = signal.sum(axis=1) / 2
N = signal.shape[0]
print ("Complete Samplings N", N)
secs = N / float(fs_rate)
print ("secs", secs)
Ts = 1.0/fs_rate # sampling interval in time
print ("Timestep between samples Ts", Ts)
t = scipy.arange(0, secs, Ts) # time vector as scipy arange field / numpy.ndarray
FFT = abs(scipy.fft(signal))
FFT_side = FFT[range(N//4)] # one side FFT range
freqs = scipy.fftpack.fftfreq(signal.size, t[1]-t[0])
fft_freqs = np.array(freqs)
freqs_side = freqs[range(N//4)] # one side frequency range
fft_freqs_side = np.array(freqs_side)
makespositive = signal[44100:]*(-1)
logal = np.log10(makespositive)
sn1 = np.mean(logal[1:44100])
sn2 = np.mean(logal[44100:88200])
sn3 = np.mean(logal[88200:132300])
sn4 = np.mean(logal[132300:176400])
print(sn1)
print(sn2)
print(sn3)
print(sn4)
abs(FFT_side)
for a in range(500):
FFT_side[a] = 0
plt.subplot(311)
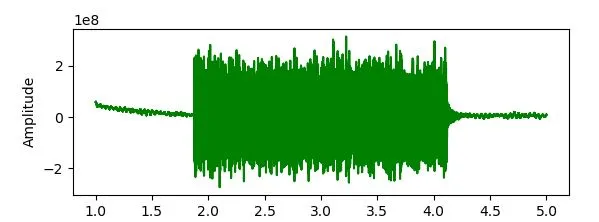
p1 = plt.plot(t[44100:], signal[44100:], "g") # plotting the signal
plt.xlabel('Time')
plt.ylabel('Amplitude')
plt.subplot(312)
p1 = plt.plot(t[44100:], logal, "r") # plotting the signal
plt.xlabel('Time')
plt.ylabel('Amplitude')
plt.subplot(313)
p3 = plt.plot(freqs_side, abs(FFT_side), "b") # plotting the positive fft spectrum
plt.xlabel('Frequency (Hz)')
plt.ylabel('Count single-sided')
plt.show()
第一个图是振幅与时间的关系,第二个图是前一个图的对数图像,最后一个图是FFT。
在sn1和sn2部分,我尝试从信号中计算出dB值。首先我取了对数,然后计算了每秒钟的均值。但这并没有给我明显的关联。我也尝试过另外一种方法,但它并不起作用。
import numpy as np
import matplotlib.pyplot as plt
import scipy.io.wavfile as wf

fs, signal = wf.read('output.wav')  # Load the file
ref = 32768  # 0 dBFS is 32678 with an int16 signal

N = 8192
win = np.hamming(N)
x = signal[0:N] * win                             # Take a slice and multiply by a window
sp = np.fft.rfft(x)                               # Calculate real FFT
s_mag = np.abs(sp) * 2 / np.sum(win)              # Scale the magnitude of FFT by window and factor of 2,
                                                  # because we are using half of FFT spectrum
s_dbfs = 20 * np.log10(s_mag / ref)               # Convert to dBFS
freq = np.arange((N / 2) + 1) / (float(N) / fs)   # Frequency axis
plt.plot(freq, s_dbfs)
plt.grid(True)
那么我应该执行哪些步骤?(对所有频率振幅进行求和/平均值,然后取对数或反向,或对信号执行此操作等。)
import numpy as np
import matplotlib.pyplot as plt
import scipy.io.wavfile as wf

fs, signal = wf.read('db1.wav')

signal2 = signal[44100:]
chunk_size = 44100
num_chunk  = len(signal2) // chunk_size
sn = []
for chunk in range(0, num_chunk):
    sn.append(np.mean(signal2[chunk*chunk_size:(chunk+1)*chunk_size].astype(float)**2))

print(sn)

logsn = 20*np.log10(sn)

print(logsn)
输出:
[4.6057844427695475e+17, 5.0025315250895744e+17, 5.028593412665193e+17, 4.910948397471887e+17]
[353.26607217 353.98379668 354.02893044 353.82330741]
[16105357.619081633,-3698520.4044557824,-4771604.623208617,48875571.17558957]。第一和最后第二个是静音(约33 dB),在这些之间有吸尘器(约55 dB)。我不明白为什么第一个和最后一个值不相同或接近。此外,由于负性,我遇到了错误:[16105357.619081633,-3698520.4044557824,-4771604.623208617,48875571.17558957]。 - Selim Turkoglusn作为平方量的均值(因此为正数)不应该是负数。假设您完全按照我的代码使用(即没有拼写错误),那么可能信号包含整数值,在平方操作期间会溢出。您可以尝试(signal[...].astype(float))**2。 - SleuthEye[2.3161987933791843e + 17,2.5553999430996653e + 17,2.568668790355783e + 17,2.4620444302688246e + 17] [347.29551662 348.14917762 348.19416218 347.82591772]。此外,您可以检查第一个代码的新图表@SleuthEye。 - Selim Turkoglu[2.139055863683949e+17,2.249777252317077e+17,2.3267567615403248e+17,2.3808157320083248e+17,2.484 5883573462458e+17,2.5547951221054723e+17,2.5414628804703328e+17,2.5556553717743168e+17,2.5664029 974492352e+17,2.558683343698968e+17,2.591194857540977e+17,2.5686734537040586e+17,2.5666697693860 944e+17,2.5736359217607843e+17,2.543169949387e+17,2.5226561521156406e+17,2.4434635201936656e+17, 2.448911185499071e+17,2.4480967355009898e+17,2.4470945580347578e+17]- Selim Turkoglu