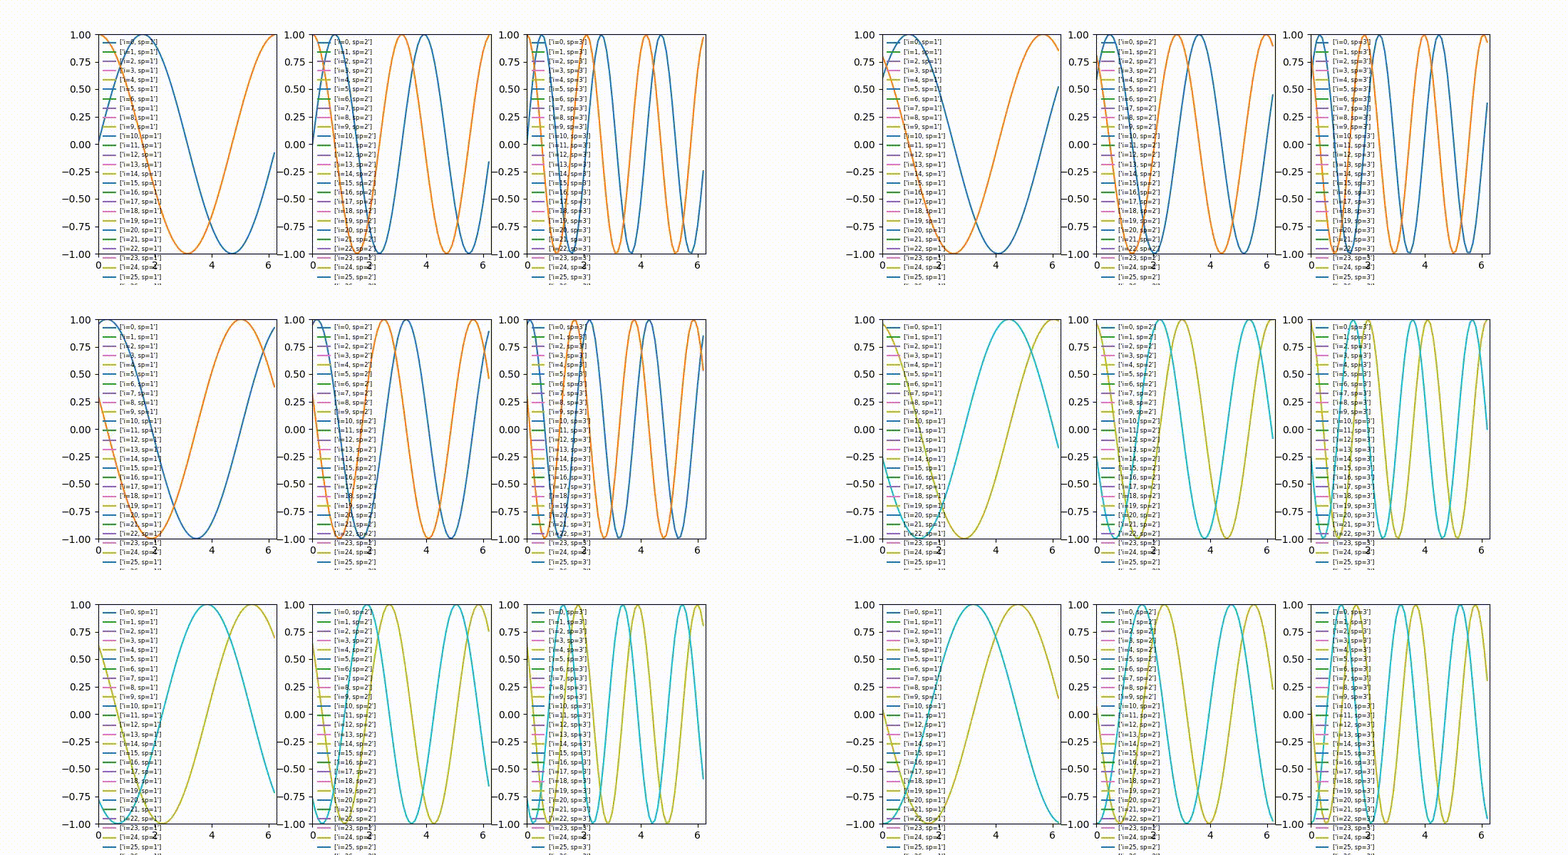
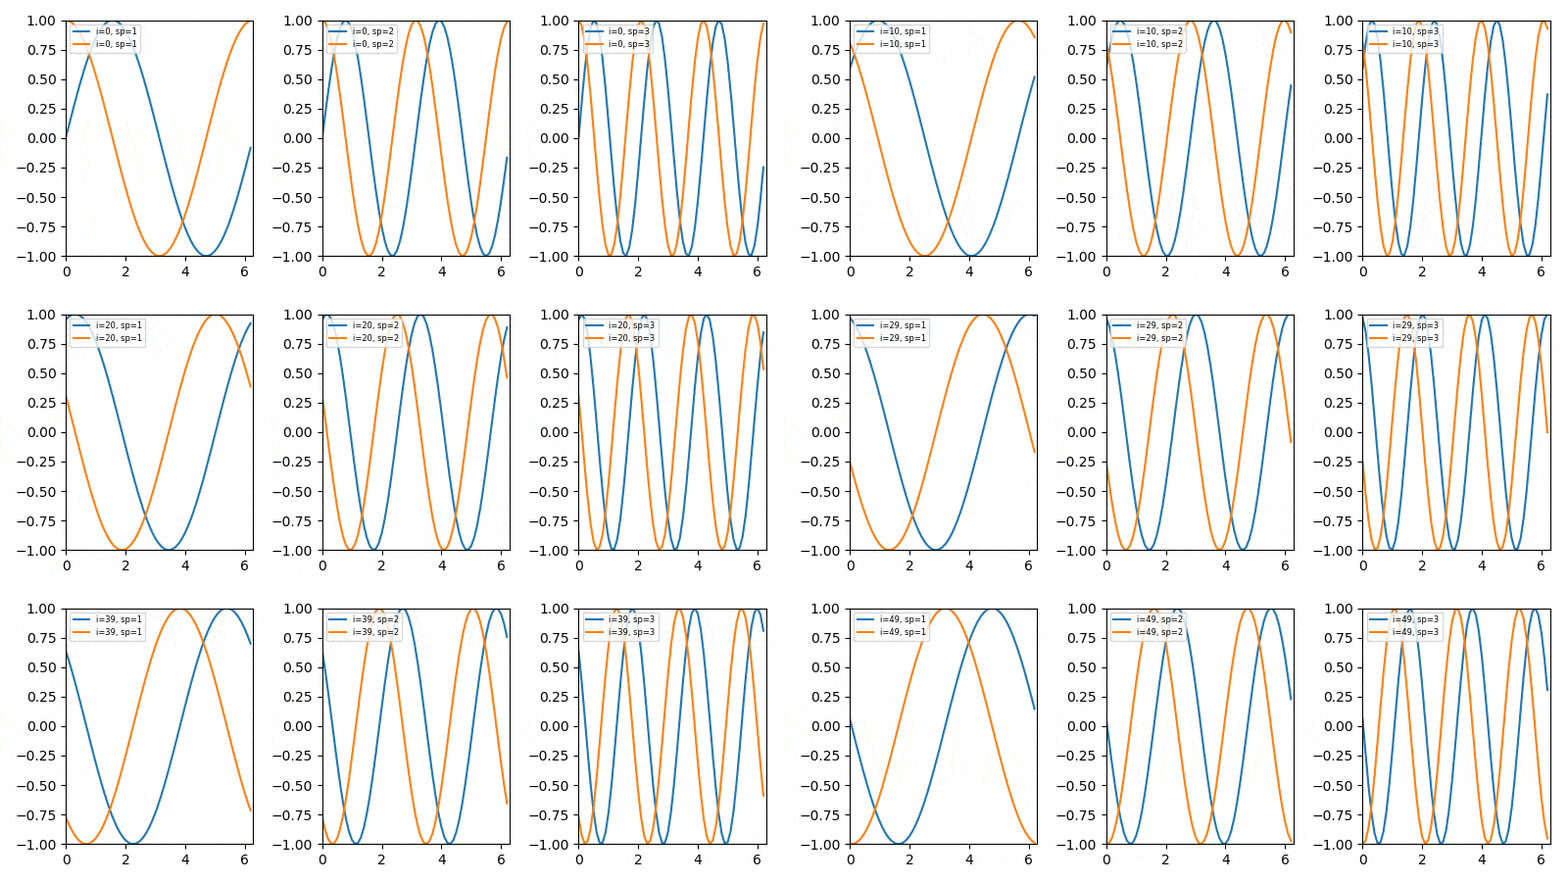
我希望能够使用ArtistAnimation绘制动画子图。不幸的是,我无法弄清楚如何制作动态图例。我尝试了在StackOverflow上找到的不同方法。如果我设法获得一个图例,它就不是动态的,而只是所有动画步骤的图例。
我的代码看起来像这样:
import numpy as np
import pylab as pl
import matplotlib.animation as anim

fig, (ax1, ax2, ax3) = pl.subplots(1,3,figsize=(11,4))
ims   = []
im1   = ['im11','im12','im13']
im2   = ['im21','im22','im23']
x = np.arange(0,2*np.pi,0.1)

n=50
for i in range(n):
    for sp in (1,2,3):
        pl.subplot(1,3,sp)

        y1 = np.sin(sp*x + i*np.pi/n)
        y2 = np.cos(sp*x + i*np.pi/n)

        im1[sp-1], = pl.plot(x,y1)
        im2[sp-1], = pl.plot(x,y2)

        pl.xlim([0,2*np.pi])
        pl.ylim([-1,1])

        lab = 'i='+str(i)+', sp='+str(sp)
        im1[sp-1].set_label([lab])
        pl.legend(loc=2, prop={'size': 6}).draw_frame(False)

    ims.append([ im1[0],im1[1],im1[2], im2[0],im2[1],im2[2] ])

ani = anim.ArtistAnimation(fig,ims,blit=True)
pl.show()
我认为这段代码应该等同于这里使用的方法:如何在Python动画中添加图例/标签,但显然我错过了一些东西。
我也尝试按照在Matplotlib中为艺术家动画添加图例中建议的设置标签,但我不真正理解如何将其用于我的案例。像这样:
im2[sp-1].legend(handles='-', labels=[lab])
我遇到了一个
AttributeError: 'Line2D' object has no attribute 'legend'错误。
[编辑]:我没有说清楚:我想在图表中为两条线都添加图例。

legs2并手动将其移动到正确的位置,但它不会自动与第二个(这里是橙色)数据相关联。到目前为止,我更喜欢循环版本(而不是使用def),因为实际上,我正在处理具有 30000 个i的数据,并且必须跳过大部分数据。是否有一种方法在update(i)中包含类似于continue或break条件? - Waterkantframes=something给定的i调用update函数与循环for i in something是相同的。因此,我认为这没有任何问题。但是当然,您也可以从上面的代码创建一个ArtistAnimation,只需将图例添加到列表artists中即可。我在答案中更新了两个图例条目。 - ImportanceOfBeingErnest