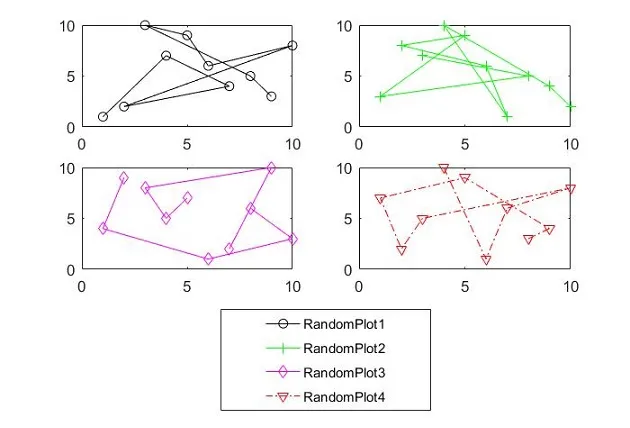
我正在尝试创建一个子图的图表。我不想让子图有图例,而是让整个图表有一个总的图例。
我读到可以通过在最后一个子图上添加图例,并通过
以下是我的代码:
我读到可以通过在最后一个子图上添加图例,并通过
legend的position特性调整其在图表中的位置,或者使用一个子图图形位置(例如,subplot(2,3,5.5)仅用于显示图例)来实现这一点。我更喜欢第二个选项,但到目前为止我还没有成功。有人能帮忙吗?以下是我的代码:
SLS=figure();
hold on
subplot(3,2,1);
plot(t,u{1},t,u{2},t,u{3},t,u{4},t,u{5},t,u{6});
title('SLS Levels');
subplot(3,2,2);
plot(t,log_u{1},t,log_u{2},t,log_u{3},t,log_u{4},t,log_u{5},t,log_u{6});
title('SLS Logarithms');
subplot(3,2,3);
plot(t,I_u{1},t,I_u{2},t,I_u{3},t,I_u{4},t,I_u{5},t,I_u{6});
title('SLS Levels with Intercept');
subplot(3,2,4);
plot(t,log_I_u{1},t,log_I_u{2},t,log_I_u{3},t,log_I_u{4},t,log_I_u{5},t,log_I_u{6});
title('SLS Log. with Intercept');
subplot(3,2,5.5);
legend('GDP', 'C', 'I', 'G', 'Imp.', 'Exp.');
axis off

0.5的增量,之前不知道!这是个好方法。 - Wolfiesubplot()的第一个参数必须是整数,但其他参数显然不需要! - jvriesem