如何计算曲线下面积(AUC)的部分面积

16
在scikit learn中,您可以使用以下方法计算二元分类器下曲线下面积:
roc_auc_score( Y, clf.predict_proba(X)[:,1] )

我只对假阳性率低于0.1的曲线部分感兴趣。

在给定这样的假阳性率阈值的情况下,如何计算曲线上超过该阈值的部分的AUC?

以下是几个ROC曲线的示例,仅用于说明:

Illustration of ROC-curves plot for several types of a classifier.

Scikit-learn文档展示了如何使用roc_curve。

>>> import numpy as np
>>> from sklearn import metrics
>>> y = np.array([1, 1, 2, 2])
>>> scores = np.array([0.1, 0.4, 0.35, 0.8])
>>> fpr, tpr, thresholds = metrics.roc_curve(y, scores, pos_label=2)
>>> fpr
array([ 0. ,  0.5,  0.5,  1. ])
>>> tpr
array([ 0.5,  0.5,  1. ,  1. ])
>>> thresholds
array([ 0.8 ,  0.4 ,  0.35,  0.1 ]

有没有简单的方法从这里转换到部分AUC?


似乎唯一的问题是如何计算当fpr = 0.1时的tpr值,因为roc_curve不一定会给你那个值。

8个回答

14

假设我们从以下情况开始:

import numpy as np
from sklearn import  metrics

现在我们设置真实的y和预测的scores

y = np.array([0, 0, 1, 1])

scores = np.array([0.1, 0.4, 0.35, 0.8])

(注意:与您的问题相比,y已向下移动1。 这无关紧要:在预测1,2或0,1时获得完全相同的结果(fpr、tpr、阈值等),但是如果不使用0,1,则部分sklearn.metrics函数会变得麻烦。)

让我们看看这里的AUC:

>>> metrics.roc_auc_score(y, scores)
0.75

就像你的例子一样:

fpr, tpr, thresholds = metrics.roc_curve(y, scores)
>>> fpr, tpr
(array([ 0. ,  0.5,  0.5,  1. ]), array([ 0.5,  0.5,  1. ,  1. ]))

这将产生以下图表:

plot([0, 0.5], [0.5, 0.5], [0.5, 0.5], [0.5, 1], [0.5, 1], [1, 1]);

enter image description here

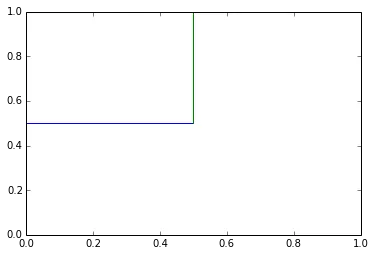
对于有限长度的y,ROC曲线将由矩形组成:

  • 对于足够低的阈值,所有内容都将被分类为负面。

  • 随着阈值的不断增加,在离散点处,一些负面分类将变为正面。

因此,对于有限的y,ROC曲线将始终由连接(0, 0)(1, 1)的水平和垂直线序列来描述。

AUC是这些矩形的总和。如上所示,AUC为0.75,因为矩形的面积为0.5 * 0.5 + 0.5 * 1 = 0.75。

在某些情况下,人们选择通过线性插值计算AUC。假设y的长度远大于FPR和TPR计算出的实际点数。那么,在这种情况下,线性插值是中间点可能存在的近似值。在某些情况下,人们还遵循猜想,即如果y足够大,则两点之间的点将被线性插值。 sklearn.metrics不使用此猜想,为了获得与sklearn.metrics一致的结果,需要使用矩形而不是梯形求和。

让我们编写自己的函数直接从fprtpr计算AUC:

import itertools
import operator

def auc_from_fpr_tpr(fpr, tpr, trapezoid=False):
    inds = [i for (i, (s, e)) in enumerate(zip(fpr[: -1], fpr[1: ])) if s != e] + [len(fpr) - 1]
    fpr, tpr = fpr[inds], tpr[inds]
    area = 0
    ft = zip(fpr, tpr)
    for p0, p1 in zip(ft[: -1], ft[1: ]):
        area += (p1[0] - p0[0]) * ((p1[1] + p0[1]) / 2 if trapezoid else p0[1])
    return area

该函数获取FPR和TPR,并包含一个可选参数,用于指定是否使用梯形求和。运行该函数,我们得到:

>>> auc_from_fpr_tpr(fpr, tpr), auc_from_fpr_tpr(fpr, tpr, True)
(0.75, 0.875)

对于矩形求和,我们得到与 sklearn.metrics 相同的结果,对于梯形求和,我们得到不同但更高的结果。

所以,现在我们只需要看一下如果在 FPR 为 0.1 时终止会发生什么情况。我们可以使用bisect 模块来实现这一点。

import bisect

def get_fpr_tpr_for_thresh(fpr, tpr, thresh):
    p = bisect.bisect_left(fpr, thresh)
    fpr = fpr.copy()
    fpr[p] = thresh
    return fpr[: p + 1], tpr[: p + 1]

这是如何工作的?它仅检查threshfpr中的插入点。鉴于FPR的属性(必须从0开始),插入点必须位于水平线上。因此,此之前的所有矩形都不应受影响,此之后的所有矩形都应被删除,而此矩形可能会被缩短。

让我们应用它:

fpr_thresh, tpr_thresh = get_fpr_tpr_for_thresh(fpr, tpr, 0.1)
>>> fpr_thresh, tpr_thresh
(array([ 0. ,  0.1]), array([ 0.5,  0.5]))

最后,我们只需要从更新的版本计算AUC:

>>> auc_from_fpr_tpr(fpr, tpr), auc_from_fpr_tpr(fpr, tpr, True)
0.050000000000000003, 0.050000000000000003)
在这种情况下,矩形和梯形求和法都得出相同的结果。请注意,通常情况下它们不会得到相同的结果。为了与sklearn.metrics保持一致,应该使用第一个方法。

我有点困惑,因为似乎我能在网上找到的所有材料都说我们应该使用梯形法则。例如,请参见http://stats.stackexchange.com/questions/145566/how-to-calculate-area-under-the-curve-auc-or-the-c-statistic-by-hand。“我们可以非常容易地使用梯形面积公式计算ROC曲线下的面积:” - Simd
谢谢。当您查看ROC曲线时,似乎它们是通过直线连接点而不是水平线连接的。绝对令人困惑。 - Simd
1
@eleanora 没错,我同意。我计划写一篇长篇解释,为什么水平线在这里是正确的,以及为什么它们在那里做梯形线。再次道歉,只能在工作后才能完成(这不是一个简短的解释)。 - Ami Tavory
@eleanora 请查看更新,其中显示了矩形和梯形两种替代方案的说明,并更改终止于0.1。 - Ami Tavory
FYI - 这个实现对我来说没有给出正确的结果。我认为这是由于你的 get_fpr_tpr_for_thresh 函数没有找到给定 FPR 水平的正确 TPR 交点所致。我使用了真实数据,即使 AUC 计算也与阈值=1不匹配。我在下面的另一个答案中添加了我测试过并且似乎有效的实现。 - SriK
显示剩余6条评论

10

6

仅在范围[0.0,0.1]内计算您的fpr和tpr值。

然后,您可以使用numpy.trapz来评估部分AUC(pAUC),如下所示:

pAUC = numpy.trapz(tpr_array, fpr_array)

这个函数使用复合梯形法来计算曲线下的面积。


谢谢。您介意填写最后一部分吗?即如何仅在范围[0.0,0.1]内计算fpr和tpr值。 - Simd
我认为梯形积分在这里根本不适用——它绝对不会近似于真正的积分,而真正的积分本质上是矩形的。 - Ami Tavory
@eleanora 不好意思,我不确定(没有足够的时间去研究你问题背后的数学),但我认为是这样的。顺便说一下,你的链接在我这里一直卡着(无法打开)。 - Ami Tavory
@eleanora 这取决于你的情况。如果你已经有了在[0,1]范围内的fpr和tpr值,那么你只需要使用类似numpy.where的过滤器,并使用条件fpr < 0.1进行过滤即可。如果你只有二进制预测结果(例如:对于C1或C2类别,为0或1),则首先需要确定每个预测是正确还是错误的,以FP、TP、FN或TN为衡量标准。然后,根据任何给定的阈值,计算tpr和fpr将变得容易。我可以根据你的情况为你提供指导。 - fmigneault
@eleanora 我会选择最接近0.1的值和稍微大于0.1的值来插值fpr=0.1处的值。由于您没有直接给出,因此必须采用这种近似方法。 - fmigneault
显示剩余4条评论

1
roc_auc_score()中,max_fpr参数不能直接使用,因为计算得到的部分AUC (pAUC)是标准化的。您需要根据标准化的pAUC进行逆向计算pAUC

1

我实现了当前最佳答案,但并不在所有情况下都给出正确的结果。我重新实现并测试了以下实现方式。我还利用了内置的梯形面积函数,而不是从头开始重新创建。

def line(x_coords, y_coords):
    """
    Given a pair of coordinates (x1,y2), (x2,y2), define the line equation. Note that this is the entire line vs. t
    the line segment.

    Parameters
    ----------
    x_coords: Numpy array of 2 points corresponding to x1,x2
    x_coords: Numpy array of 2 points corresponding to y1,y2

    Returns
    -------
    (Gradient, intercept) tuple pair
    """    
    if (x_coords.shape[0] < 2) or (y_coords.shape[0] < 2):
        raise ValueError('At least 2 points are needed to compute'
                         ' area under curve, but x.shape = %s' % p1.shape)
    if ((x_coords[0]-x_coords[1]) == 0):
        raise ValueError("gradient is infinity")
    gradient = (y_coords[0]-y_coords[1])/(x_coords[0]-x_coords[1])
    intercept = y_coords[0] - gradient*1.0*x_coords[0]
    return (gradient, intercept)

def x_val_line_intercept(gradient, intercept, x_val):
    """
    Given a x=X_val vertical line, what is the intersection point of that line with the 
    line defined by the gradient and intercept. Note: This can be further improved by using line
    segments.

    Parameters
    ----------
    gradient
    intercept

    Returns
    -------
    (x_val, y) corresponding to the intercepted point. Note that this will always return a result.
    There is no check for whether the x_val is within the bounds of the line segment.
    """    
    y = gradient*x_val + intercept
    return (x_val, y)

def get_fpr_tpr_for_thresh(fpr, tpr, thresh):
    """
    Derive the partial ROC curve to the point based on the fpr threshold.

    Parameters
    ----------
    fpr: Numpy array of the sorted FPR points that represent the entirety of the ROC.
    tpr: Numpy array of the sorted TPR points that represent the entirety of the ROC.
    thresh: The threshold based on the FPR to extract the partial ROC based to that value of the threshold.

    Returns
    -------
    thresh_fpr: The FPR points that represent the partial ROC to the point of the fpr threshold.
    thresh_tpr: The TPR points that represent the partial ROC to the point of the fpr threshold
    """    
    p = bisect.bisect_left(fpr, thresh)
    thresh_fpr = fpr[:p+1].copy()
    thresh_tpr = tpr[:p+1].copy()
    g, i = line(fpr[p-1:p+1], tpr[p-1:p+1])
    new_point = x_val_line_intercept(g, i, thresh)
    thresh_fpr[p] = new_point[0]
    thresh_tpr[p] = new_point[1]
    return thresh_fpr, thresh_tpr

def partial_auc_scorer(y_actual, y_pred, decile=1):
    """
    Derive the AUC based of the partial ROC curve from FPR=0 to FPR=decile threshold.

    Parameters
    ----------
    y_actual: numpy array of the actual labels.
    y_pred: Numpy array of The predicted probability scores.
    decile: The threshold based on the FPR to extract the partial ROC based to that value of the threshold.

    Returns
    -------
    AUC of the partial ROC. A value that ranges from 0 to 1.
    """        
    y_pred = list(map(lambda x: x[-1], y_pred))
    fpr, tpr, _ = roc_curve(y_actual, y_pred, pos_label=1)
    fpr_thresh, tpr_thresh = get_fpr_tpr_for_thresh(fpr, tpr, decile)
    return auc(fpr_thresh, tpr_thresh)

1
这取决于FPR是x轴还是y轴(独立或者依赖变量)。
如果是x轴,计算很简单:只需在范围[0.0, 0.1]内进行计算。
如果是y轴,则首先需要解出y = 0.1的曲线。这将把x轴分成需要计算的区域和高度为0.1的简单矩形。
举个例子,假设你发现函数超过0.1的范围有两个:[x1, x2]和[x3, x4]。则需要计算这些范围下曲线下方的面积。
[0, x1]
[x2, x3]
[x4, ...]

在此基础上,将找到的两个区间下方y=0.1的矩形相加:
area += (x2-x1 + x4-x3) * 0.1

那是你需要的来推动你前进的吗?


我只用过一个函数来计算AUC。fpr在X轴上(请参见问题中的示例),但我不知道如何计算AUC。 - Simd
你可以使用同一个函数进行计算。如果该函数仅适用于整个曲线,则在调用函数之前,请将曲线数据裁剪至X=0.1。 - Prune
predict_proba会为每个向量给出属于类别1的概率,您如何适当地裁剪它? - Simd
你如何计算在fpr=0.1时的tpr值? - Simd

1

如果fpr和tpr数组中的点足够多,您可能可以忽略边缘效应。至少作为第一步来思考问题,让我们这样做。 我们将假阳性率阈值称为fprt。 现在退一步,暂时忽略它是ROC曲线。我们可以排除fpr> fprt的数据,因为我们不需要该曲线部分下面的面积。 我们可以使用以下方式绘制:

i = fpr <= fprt
roc_display = RocCurveDisplay(fpr=fpr[i], tpr=tpr[i]).plot()

我们可以使用以下方法来获取该区域:
pauc_approx = auc(fpr[i], tpr[i])

现在这可能已经足够好了。问题出现在图表的右侧,我们排除了一些数据。以你的例子为例,如果fprt为0.1,并且在0.07、0.09、0.12等处有fpr数据,我们将割掉在0.09处汇聚的区域,但是我们的fprt为0.1,失去了一些应该收集的区域。不过我们可以通过将该切片作为矩形添加回来来解决这个问题:

max_i = np.argmax(fpr[i])
pauc_extra = (fprt-fpr[i][max_i]) * tpr[i][max_i]
pauc_better = pauc_approx + pauc_extra

这是来自我的一些数据的示例。它有大约2000个样本。这是完整的ROC曲线。 Full ROC Curve 这是排除fpr数据> 0.10的曲线: ROC for fpr <= 0.10 通过在此数据上计算pauc_approx,得出的面积为0.014035。您可以看到图形并没有延伸到x = 0.10。事实证明,在那里y值为0.250417的值为0.096153。因此,我们可以计算出矩形并将其添加到区域中:pauc_extra = (fprt-fpr[i][max_i]) * tpr[i][max_i](0.10 - 0.09615384615384616)*0.25041736227045075等于要添加到我们的pauc_approx的0.0009631437010401953的面积,以获得更好的面积估计。
虽然不是原始问题的一部分,但这种方法可以扩展到TPR阈值的情况,这正是我需要的。下面是维基百科的部分AUROC示例图表。在几何上查看此图,您可以发现我们可以排除未满足阈值的TPR和FPR数据,然后需要将数据沿y轴向下移动TPR阈值。使用这些新数据,我们可以计算所示曲线部分下的适当面积。右侧的修正可以增加更高的准确性。 https://en.wikipedia.org/wiki/File:Two_way_pAUC.png

0

@eleanora 你使用sklearn的通用metrics.auc方法的冲动是正确的(这就是我所做的)。一旦你获得了tpr和fpr点集,应该很简单(你可以使用scipy的插值方法来近似任一系列中的精确点)。


网页内容由stack overflow 提供, 点击上面的
可以查看英文原文,
原文链接