我想自动换行ggplot2中的标签,即在长标签处插入换行符。在这里写了如何编写一个函数(1)实现它,但遗憾的是我不知道在我的代码(2)中放置
labeller=label_wrap的位置。 这里 编写了该函数的说明。label_wrap <- function(variable, value) {
lapply(strwrap(as.character(value), width=25, simplify=FALSE),
paste, collapse="\n")
}
(2) 代码示例
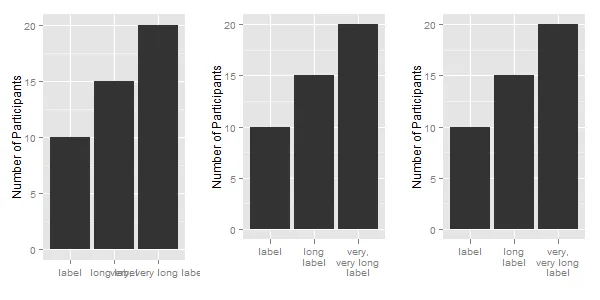
df = data.frame(x = c("label", "long label", "very, very long label"),
                y = c(10, 15, 20))

ggplot(df, aes(x, y)) + geom_bar(stat="identity")
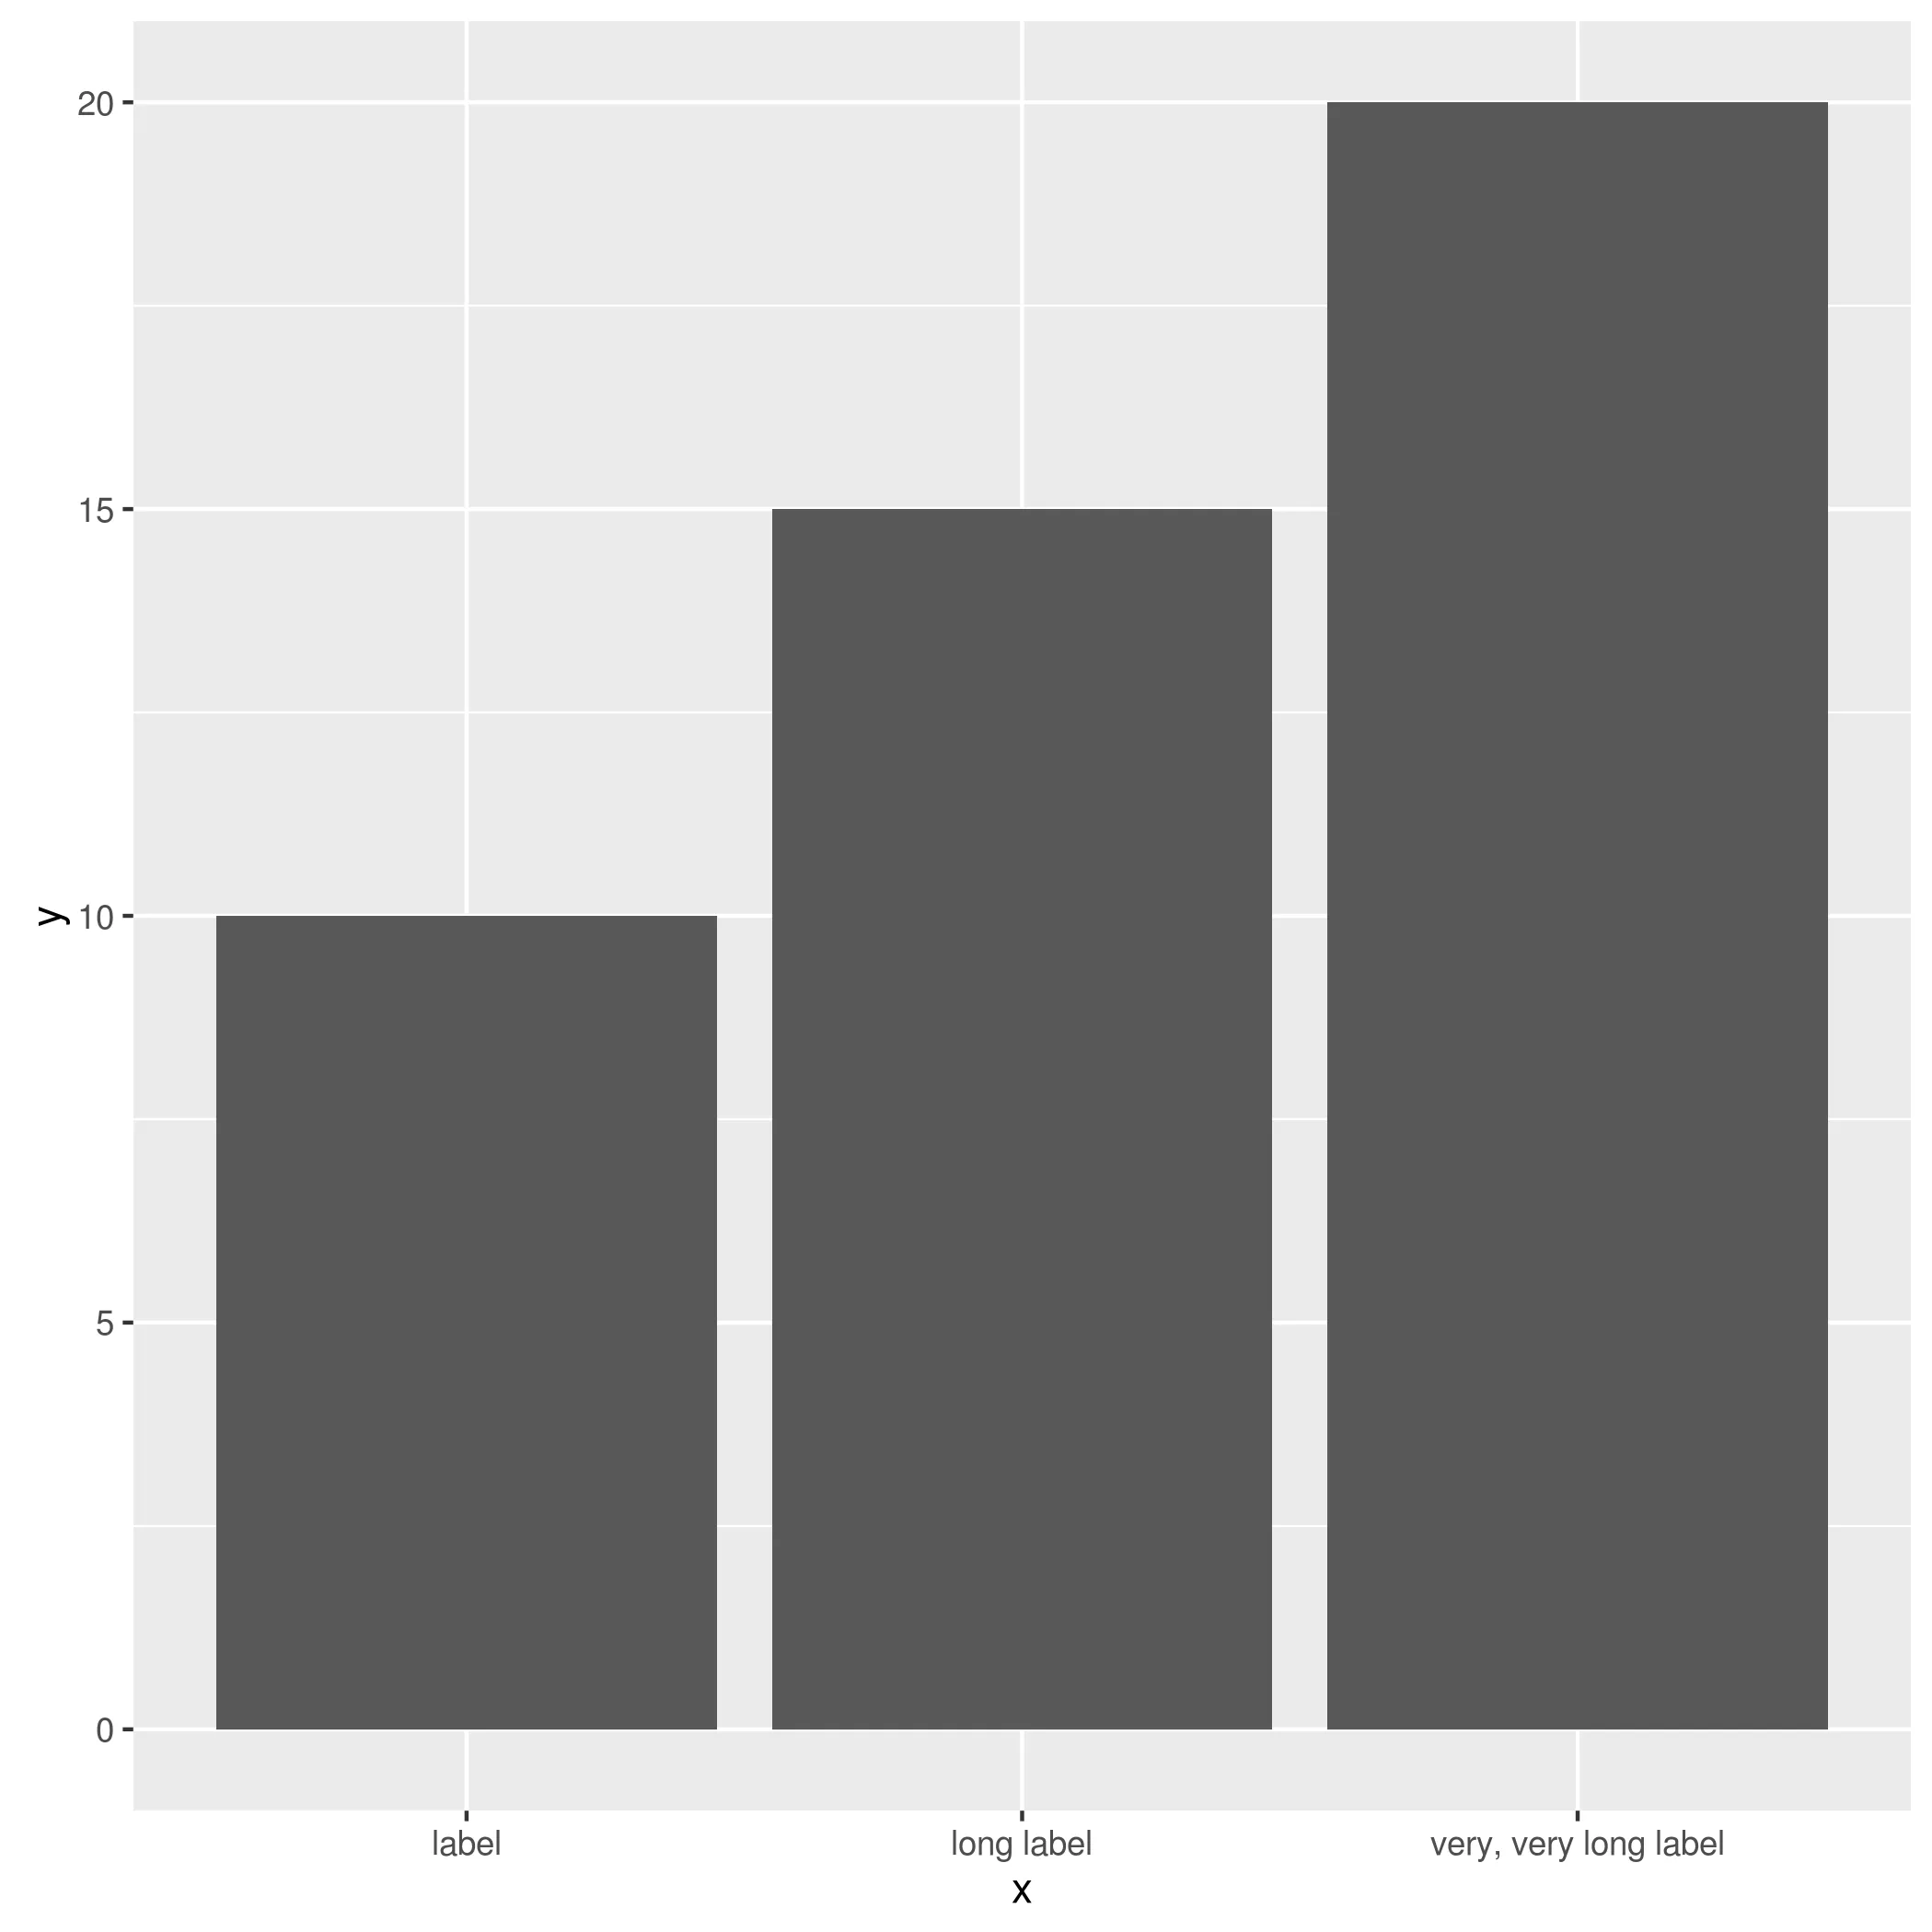
我想要对这里一些较长的标签进行换行。