我正在使用Seaborn的jointplot生成一些散点图。
以下是我所做的示例及其结果:
这是生成的图表。
我该如何改变图表中显示的文本大小(相关系数和p值)?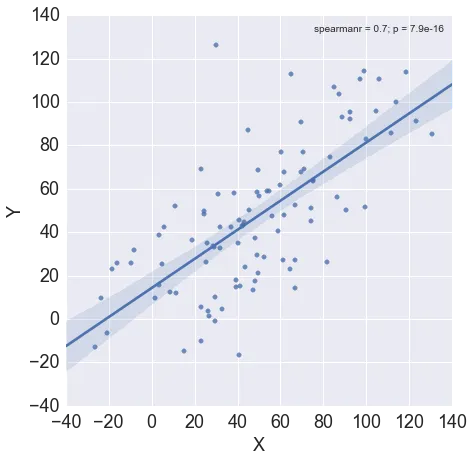
以下是我所做的示例及其结果:
from scipy import stats

x = np.arange(100) + np.random.randn(100)*20
y = np.arange(100) + np.random.randn(100)*20

g = sb.JointGrid(x, y, ratio=100)
g.plot_joint(sb.regplot)
g.annotate(stats.spearmanr)
g.ax_marg_x.set_axis_off()
g.ax_marg_y.set_axis_off()
plt.xlabel('X', fontsize=18)
plt.ylabel('Y', fontsize=18)
plt.tick_params(axis="both", labelsize=18)
plt.legend(fontsize=20)
这是生成的图表。
我该如何改变图表中显示的文本大小(相关系数和p值)?
matplotlib.rc("legend", fontsize=20)看起来可以正常工作。 - celmatplotlib.rc_context)仅为一个绘图设置它。 - mwaskomrc_context会覆盖seaborn的默认绘图样式,您必须显式调用set_style。 - celrc_context的设计只设置你定义的特定参数,否则会从全局上下文继承参数。 - mwaskom