如何在绘图中使用不同的颜色绘制一条线

21

我有以下两个列表:

latt=[42.0,41.978567980875397,41.96622693388357,41.963791391892457,...,41.972407378075879]
lont=[-66.706920989908909,-66.703116557977069,-66.707351643324543,...-66.718218142021925]

现在我想把它作为一条线来绘制,将这些“latt”和“lont”记录中的每10个分开作为一个周期,并赋予其独特的颜色。 我应该怎么做?


看看 scatter http://matplotlib.org/api/pyplot_api.html#matplotlib.pyplot.scatter - tacaswell
5个回答

47

有几种不同的方法可以实现这一点。 "最佳"方法主要取决于您想绘制多少条线段。

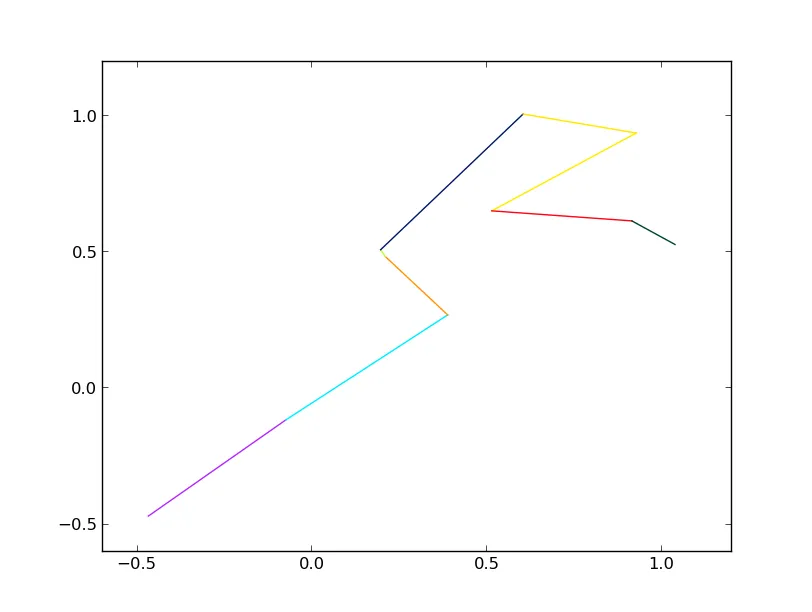
如果您只需要绘制几条(例如10条)线段,则可以执行以下操作:

import numpy as np
import matplotlib.pyplot as plt

def uniqueish_color():
    """There're better ways to generate unique colors, but this isn't awful."""
    return plt.cm.gist_ncar(np.random.random())

xy = (np.random.random((10, 2)) - 0.5).cumsum(axis=0)

fig, ax = plt.subplots()
for start, stop in zip(xy[:-1], xy[1:]):
    x, y = zip(start, stop)
    ax.plot(x, y, color=uniqueish_color())
plt.show()

enter image description here

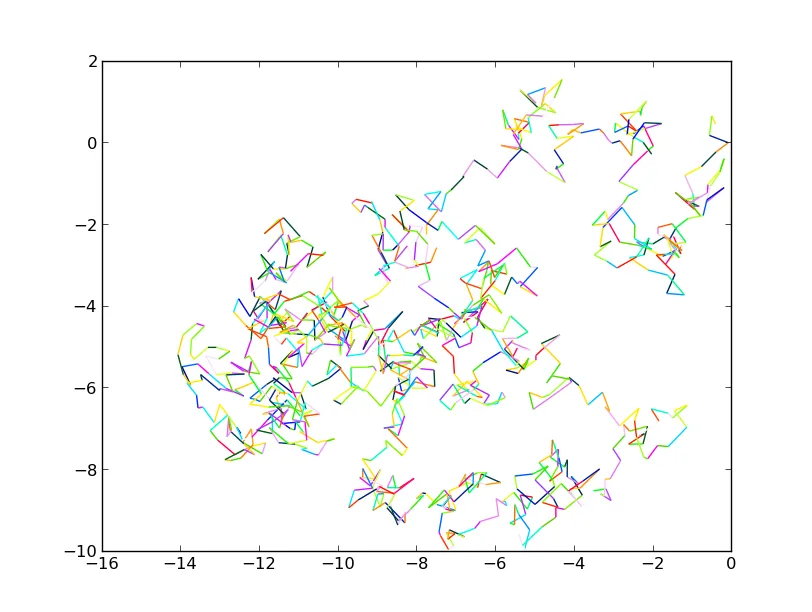
如果你要绘制的图形有一百万条线段,那么使用该方法会非常缓慢。在这种情况下,可以使用LineCollection。例如:

import numpy as np
import matplotlib.pyplot as plt
from matplotlib.collections import LineCollection

xy = (np.random.random((1000, 2)) - 0.5).cumsum(axis=0)

# Reshape things so that we have a sequence of:
# [[(x0,y0),(x1,y1)],[(x0,y0),(x1,y1)],...]
xy = xy.reshape(-1, 1, 2)
segments = np.hstack([xy[:-1], xy[1:]])

fig, ax = plt.subplots()
coll = LineCollection(segments, cmap=plt.cm.gist_ncar)
coll.set_array(np.random.random(xy.shape[0]))

ax.add_collection(coll)
ax.autoscale_view()

plt.show()

图片描述

对于这两种情况,我们只是从“gist_ncar”颜色图中随机选择颜色。在这里查看调色板(gist_ncar大约在页面的2/3处):http://matplotlib.org/examples/color/colormaps_reference.html


啊,我以为他想要从“现在我想把这个作为一条线绘制”中获取行,但重新阅读后,你可能是正确的。 - Joe Kington
1
问题:您在使用coll.set_array(np.random.random(xy.shape[0]))时指定了什么? 文档对此非常不清楚,可以参考此链接:https://matplotlib.org/api/cm_api.html#matplotlib.cm.ScalarMappable.set_array - J.A.Cado
@JoeKington 这看起来很棒,我有一个问题,如果值为负数,如何将其限制为两行,并显示红色,否则显示绿色。 - Volatil3
@J.A.Cado,set_array是一个数值,用来表示颜色。在这个例子中,他设置了一组随机的数字,但是对于我的例子,我会设置数值来表示颜色变化。 - MadmanLee

5

这个示例复制:

import numpy as np
import matplotlib.pyplot as plt
from matplotlib.collections import LineCollection
from matplotlib.colors import ListedColormap, BoundaryNorm

x = np.linspace(0, 3 * np.pi, 500)
y = np.sin(x)
z = np.cos(0.5 * (x[:-1] + x[1:]))  # first derivative

# Create a colormap for red, green and blue and a norm to color
# f' < -0.5 red, f' > 0.5 blue, and the rest green
cmap = ListedColormap(['r', 'g', 'b'])
norm = BoundaryNorm([-1, -0.5, 0.5, 1], cmap.N)

# Create a set of line segments so that we can color them individually
# This creates the points as a N x 1 x 2 array so that we can stack points
# together easily to get the segments. The segments array for line collection
# needs to be numlines x points per line x 2 (x and y)
points = np.array([x, y]).T.reshape(-1, 1, 2)
segments = np.concatenate([points[:-1], points[1:]], axis=1)

# Create the line collection object, setting the colormapping parameters.
# Have to set the actual values used for colormapping separately.
lc = LineCollection(segments, cmap=cmap, norm=norm)
lc.set_array(z)
lc.set_linewidth(3)

fig1 = plt.figure()
plt.gca().add_collection(lc)
plt.xlim(x.min(), x.max())
plt.ylim(-1.1, 1.1)

plt.show()

2
我一直在寻找如何使用pyplot的线图来展示一个由标签特征着色的时间序列的简短解决方案,而不使用scatter,因为数据点太多。我想到了以下的解决方法:
plt.plot(np.where(df["label"]==1, df["myvalue"], None), color="red", label="1")
plt.plot(np.where(df["label"]==0, df["myvalue"], None), color="blue", label="0")
plt.legend()

缺点是你正在创建两个不同的线图,因此不显示不同类之间的连接。对于我的目的来说,这并不是什么大问题。它可能会帮助某些人。

1
谢谢您,@Andre S.这对于时间序列异常检测帮助了我很多。 - Curious Watcher
1
示例图像:https://imgur.com/RcUK8Ss - Curious Watcher

2
借鉴@JoeKington的颜色选择方案,
import numpy as np
import matplotlib.pyplot as plt

def uniqueish_color(n):
    """There're better ways to generate unique colors, but this isn't awful."""
    return plt.cm.gist_ncar(np.random.random(n))

plt.scatter(latt, lont, c=uniqueish_color(len(latt)))

你可以使用scatter完成这个任务。

在Matlplotlib 3.0.0中出现“无效的RGBA参数”错误。 - Nibor

2
请参考这里的答案生成“periods”,然后按照@tcaswell所提到的方法使用matplotlib scatter函数。使用plot.hold函数,您可以绘制每个时期,颜色会自动递增。

网页内容由stack overflow 提供, 点击上面的
可以查看英文原文,
原文链接