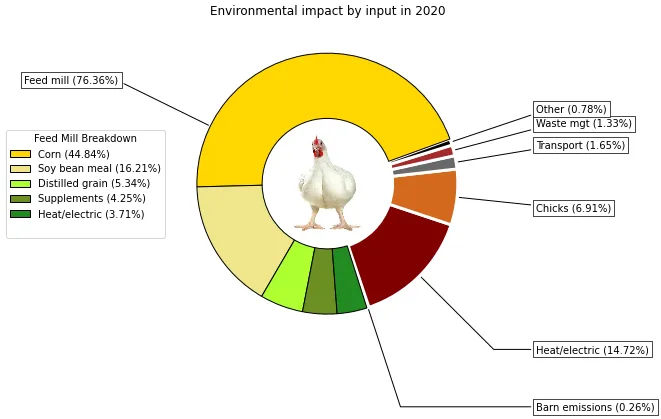
我正在使用以下代码在 matplotlib 中生成饼图。注意,图表中间有一个嵌入的图片。
fig, ax = plt.subplots(figsize=(8,6), subplot_kw=dict(aspect="equal"))

labels1 = ["Feed mill (76.36%)",
          "Barn emissions (0.26%)",
          "Heat/electric (14.72%)",
          "Chicks (6.91%)",
          "Transport (1.65%)",
          "Waste mgt (1.33%)",
          "Other (0.78%)"]

labels2 = ["Corn (44.84%)", "Soy bean meal (16.21%)", "Distilled grain (5.34%)", "Supplements (4.25%)", "Heat/electric (3.71%)", " "]

data1 = [74.36, 0.26,14.72, 6.91, 1.65, 1.33, 0.78]
data2 = [44.84, 16.21, 5.34, 4.25, 3.71, 25.65]

wedges, texts = ax.pie(data1, wedgeprops=dict(width=0.5, linewidth= 3, edgecolor ="white"), startangle=20, colors=inner_colors)
wedges[0].set_visible(False)
bbox_props = dict(boxstyle="square,pad=0.3", fc="w", ec="k", lw=0.72)
kw = dict(arrowprops=dict(arrowstyle="-"),
          bbox=bbox_props, zorder=0, va="center")

for i, p in enumerate(wedges):
    ang = (p.theta2 - p.theta1)/2. + p.theta1
    y = np.sin(np.deg2rad(ang))
    x = np.cos(np.deg2rad(ang))
    horizontalalignment = {-1: "right", 1: "left"}[int(np.sign(x))]
    connectionstyle = "angle,angleA=0,angleB={}".format(ang)
    kw["arrowprops"].update({"connectionstyle": connectionstyle})
    ax.annotate(labels1[i], xy=(x, y), xytext=(1.6*np.sign(x), 1.8*y),
                horizontalalignment=horizontalalignment, **kw)


wedges, texts = ax.pie(data2, wedgeprops=dict(width=0.5, linewidth= 1, edgecolor ="black"), startangle=20, colors=outer_colors)
wedges[5].set_visible(False)
ax.set_title("Environmental impact by input in 2020")

im = plt.imread('chicken.jpg', format='jpg')
imagebox = OffsetImage(im, zoom=0.25,zorder=-10)
ab = AnnotationBbox(imagebox, (0,0), xycoords='data', pad=0, frameon=False)
fig.gca().add_artist(ab)

ax.legend(wedges, labels2,
          title="Feed Mill Breakdown",
          loc="center left",
          bbox_to_anchor=(-0.5, 0, 0.5, 1))

plt.show()
当我运行这段代码时,会得到下面这张图片:
 但是当我尝试使用以下命令将其保存为PDF文件时:
plt.savefig('path.pdf')
它返回一张空图片。有什么想法为什么会这样?