根据BenT的答案,我可以提出一个解决方案,该解决方案还可以调整图形大小。
首先,我定义了一个方法,该方法返回稍后用于原始图和色条的两个轴:
def split_figure_vertically(figsize_1, additional_width, rect_1, rect_2):
    """
    figsize_1 is the size of the figure without the color bar
    additional_width is the additional width used for the color bar
    rect_1, rect_2 define where the plotting area and color bar are located
    in their respective sections of the figure
    """
    oldWidth_1 = figsize_1[0]
    newWidth = oldWidth_1 + additional_width
    factor_1 = oldWidth_1 / newWidth
    factor_2 = additional_width / newWidth

    figsize = (newWidth, figsize_1[1])

    fig = plt.figure(figsize=figsize)

    rect_1[0] *= factor_1
    rect_1[2] *= factor_1

    rect_2[0] *= factor_2
    rect_2[2] *= factor_2
    rect_2[0] += factor_1

    ax1 = fig.add_axes(rect_1)
    ax2 = fig.add_axes(rect_2)

    return ax1, ax2
当我想绘制颜色条时,我调用返回不同轴的函数:
figsize = (3, 3)
rect = [0.2, 0.2, 0.7, 0.7]

if colorBar:
    ax1, ax2 = split_figure_vertically(figsize, 1, rect,
                                       [0., 0.2, 0.2, 0.7])
else:
    ax1 = plt.figure(figsize=figsize).add_axes(rect)
然后我像往常一样在轴1上绘制我的内容,并按照BenT的建议在轴2上绘制颜色条。
if colorBar:
    plt.colorbar(cax=ax2)
结果如所期望。
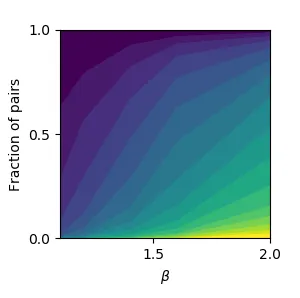
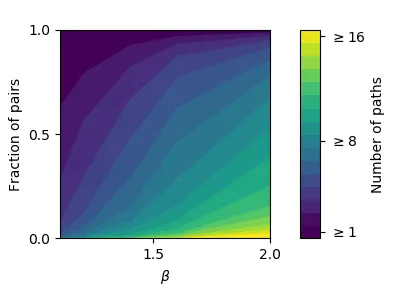
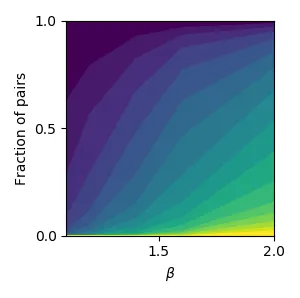
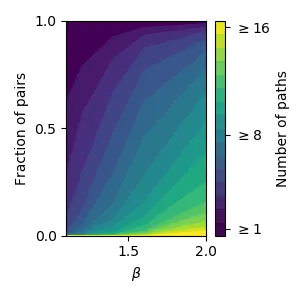
fig.add_axes([.91,.124,.04,.754])的适当参数?有没有办法自动调整这些参数,使其始终适合我的图形尺寸? - Samufi[.91,.124,.04,.754]是怎么来的,但对我来说它是有效的。 - undefined