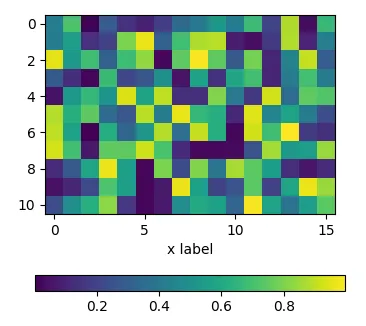
使用填充 pad
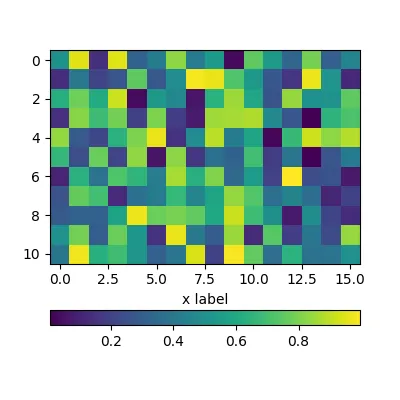
为了相对于子图移动色条,可以使用fig.colorbar的pad参数。
import matplotlib.pyplot as plt
import numpy as np; np.random.seed(1)

fig, ax = plt.subplots(figsize=(4,4))
im = ax.imshow(np.random.rand(11,16))
ax.set_xlabel("x label")

fig.colorbar(im, orientation="horizontal", pad=0.2)
plt.show()
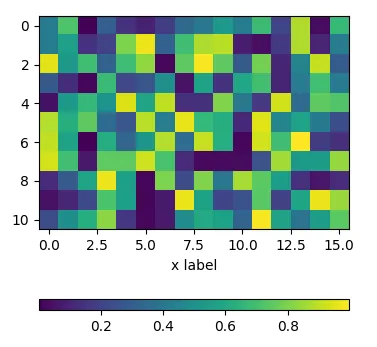
使用坐标轴分隔器
可以使用make_axes_locatable的实例来划分轴并创建一个新的轴,该轴与图像绘制完全对齐。同样,pad参数可以设置两个轴之间的间距。
import matplotlib.pyplot as plt
from mpl_toolkits.axes_grid1 import make_axes_locatable
import numpy as np; np.random.seed(1)

fig, ax = plt.subplots(figsize=(4,4))
im = ax.imshow(np.random.rand(11,16))
ax.set_xlabel("x label")

divider = make_axes_locatable(ax)
cax = divider.new_vertical(size="5%", pad=0.7, pack_start=True)
fig.add_axes(cax)
fig.colorbar(im, cax=cax, orientation="horizontal")

plt.show()
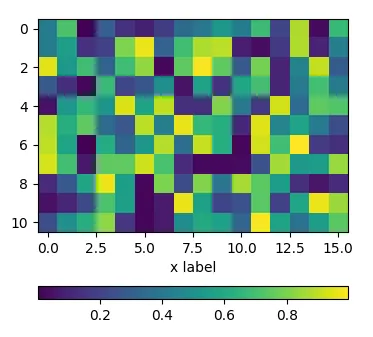
使用子图
可以直接创建两行子图,一行用于图片显示,一行用于颜色条的显示。然后,在创建图形时将 height_ratios 设置为 gridspec_kw={"height_ratios":[1, 0.05]} ,使得一个子图比另一个子图的高度小很多,这个较小的子图可以用来放置颜色条。
import matplotlib.pyplot as plt
import numpy as np; np.random.seed(1)

fig, (ax, cax) = plt.subplots(nrows=2,figsize=(4,4),
                  gridspec_kw={"height_ratios":[1, 0.05]})
im = ax.imshow(np.random.rand(11,16))
ax.set_xlabel("x label")

fig.colorbar(im, cax=cax, orientation="horizontal")

plt.show()
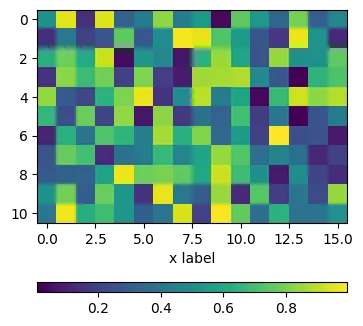
cax = divider.append_axes("top", size="5%", pad=.15),但刻度线会重叠在图像上。我一直在尝试按照这个答案向外放置它,但是没有成功,因为该答案使用了非常与众不同的matplotlib对象,而我无法在你的示例中复现那种方法。 - fabda01shrink不适用于外部创建的轴。 - ImportanceOfBeingErnest