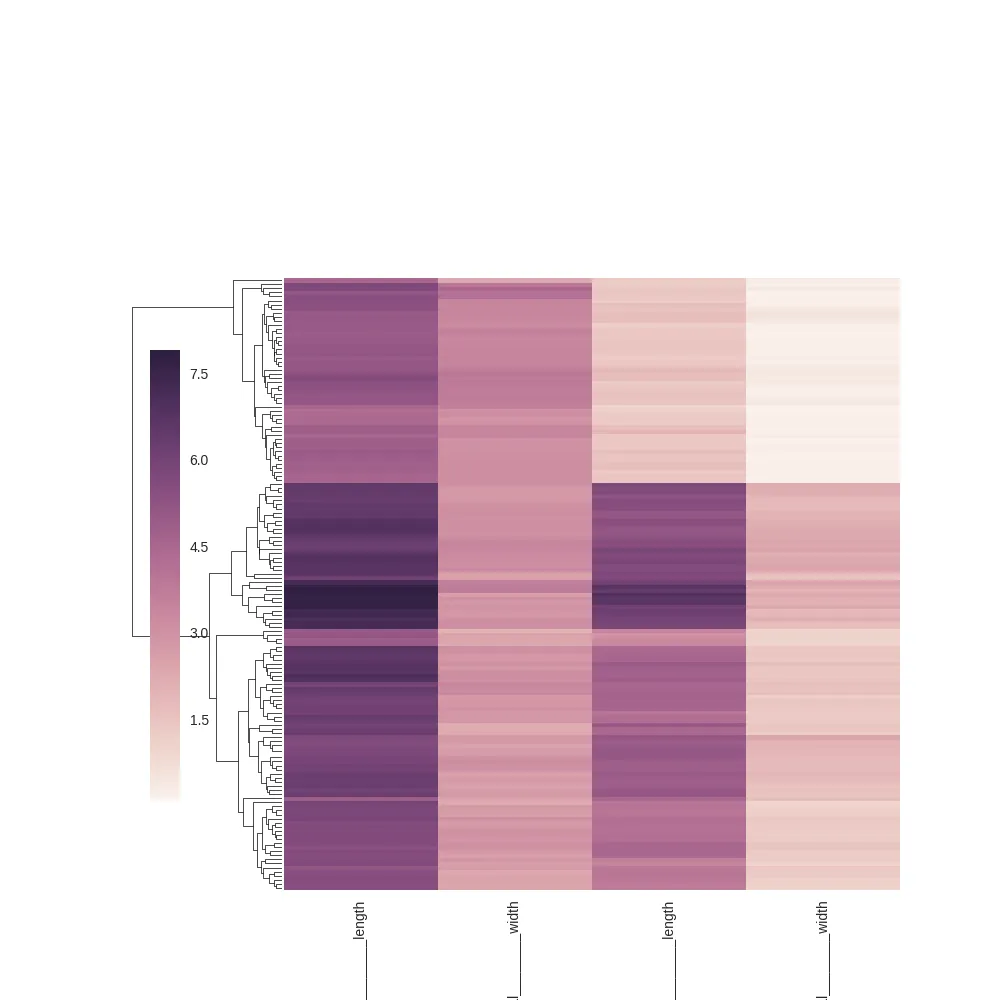
根据@ImportanceOfBeingErnest的建议,在移动颜色条之前,我尝试进行了调整。这导致了以下图片:
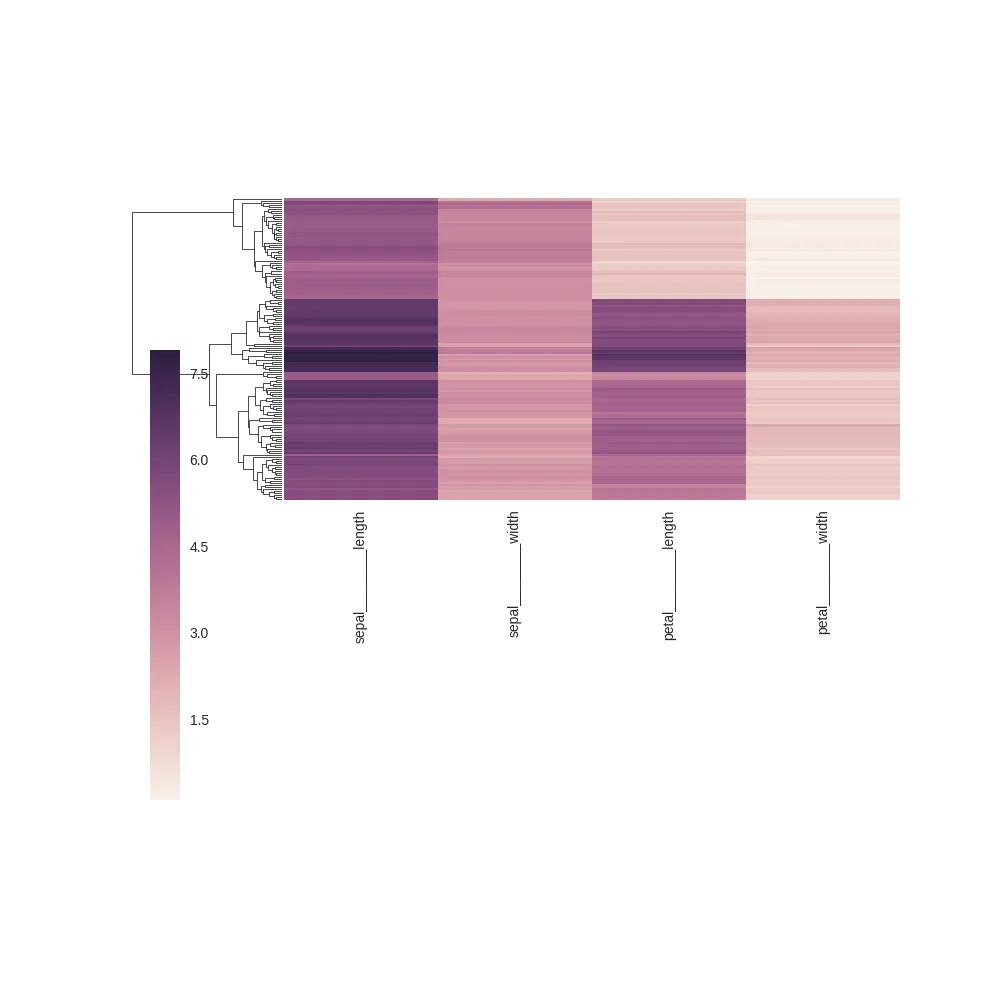
由于我实际上不需要树状图,只需要聚类结果,因此我可以通过使用树状图框来放置颜色条而获得更好的结果:
import seaborn as sns
import matplotlib.pyplot as plt
iris = sns.load_dataset("iris")
species = iris.pop("species")
iris.columns = ["________".join(label.split("_")) for label in iris.columns]
g = sns.clustermap(iris, col_cluster=False, yticklabels=False)
plt.setp(g.ax_heatmap.get_xticklabels(), rotation=90)
plt.subplots_adjust(bottom=0.5)
g.cax.set_position([.15, .2, .03, .45])
plt.savefig("/tmp/adjusted_before.png")
plt.cla()
g = sns.clustermap(iris, col_cluster=False, yticklabels=False)
plt.setp(g.ax_heatmap.get_xticklabels(), rotation=90)
plt.subplots_adjust(bottom=0.5)
g.ax_row_dendrogram.set_visible(False)
dendro_box = g.ax_row_dendrogram.get_position()
dendro_box.x0 = (dendro_box.x0 + 2 * dendro_box.x1) / 3
g.cax.set_position(dendro_box)
g.cax.yaxis.set_ticks_position("left")
plt.savefig("/tmp/adjusted_before_using_row_dendrogram_box.png")
这将生成以下图片:
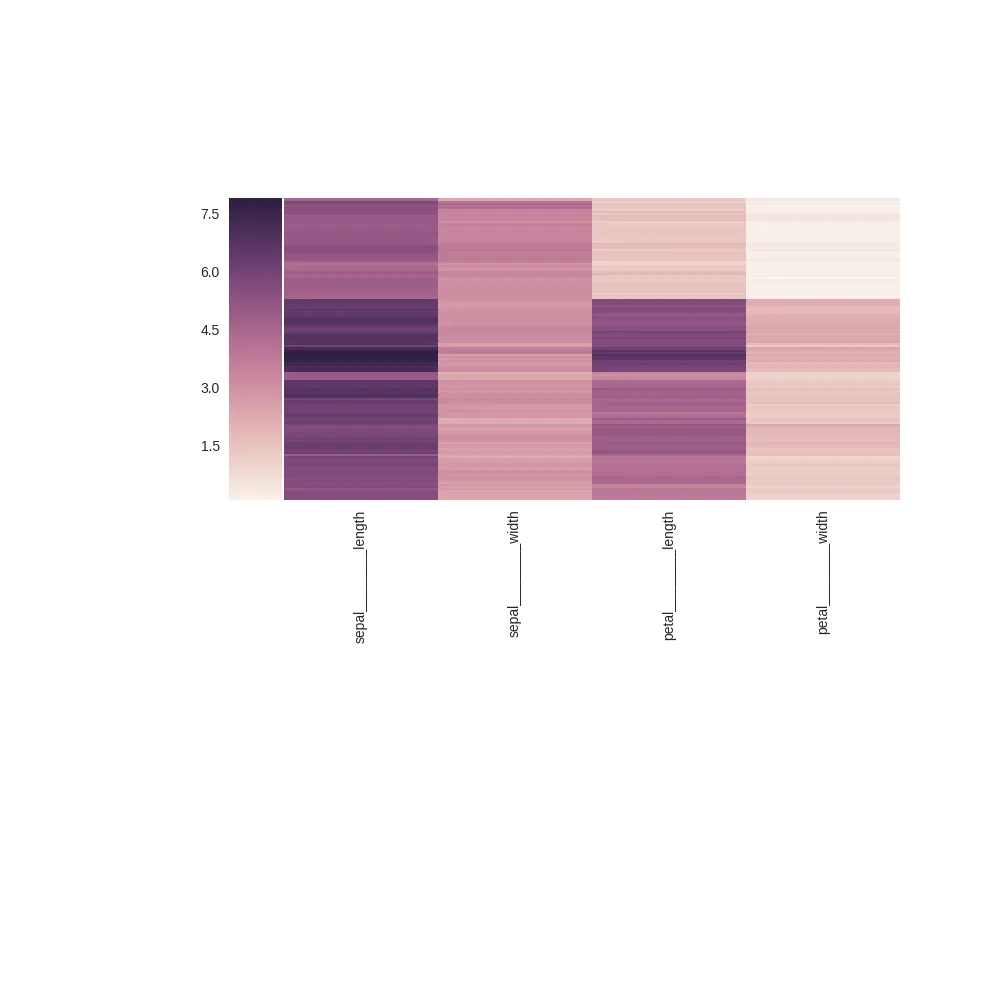
编辑:使用plt.tight_layout也会出现同样的问题。
在进一步开发我的热力图时,我想要添加带有图例的行颜色(使用此答案中提出的方法)。在我的实际应用中,图例需要足够的水平空间才能从图像中剪切出来。
我想使用plt.tight_layout来调整图像。这又干扰了颜色条的重新定位(甚至没有解决剪切图例的问题...),如下面的示例所示。
import seaborn as sns
import matplotlib.pyplot as plt
iris = sns.load_dataset("iris")
species = iris.pop("species")
iris.columns = ["________".join(label.split("_")) for label in iris.columns]
species_list = species.unique()
label_colours = dict(zip(species_list, sns.color_palette("colorblind", len(species_list))))
row_colours = species.map(label_colours)
g = sns.clustermap(iris, col_cluster=False, yticklabels=False, row_colors=row_colours, cbar_kws={"label" : "measure"})
for (label, colour) in label_colours.items():
g.ax_col_dendrogram.bar(0, 0, color=colour, label="Iris___________________{}".format(label))
g.ax_col_dendrogram.legend(loc="center", ncol=3)
plt.setp(g.ax_heatmap.get_xticklabels(), rotation=90)
plt.subplots_adjust(bottom=0.5)
g.ax_row_dendrogram.set_visible(False)
dendro_box = g.ax_row_dendrogram.get_position()
dendro_box.x0 = (dendro_box.x0 + 2 * dendro_box.x1) / 3
g.cax.set_position(dendro_box)
g.cax.yaxis.set_ticks_position("left")
g.cax.yaxis.set_label_position("left")
plt.savefig("/tmp/with_row_colour_lengend.png")
plt.cla()
g = sns.clustermap(iris, col_cluster=False, yticklabels=False, row_colors=row_colours, cbar_kws={"label" : "measure"})
for (label, colour) in label_colours.items():
g.ax_col_dendrogram.bar(0, 0, color=colour, label="Iris___________________{}".format(label))
g.ax_col_dendrogram.legend(loc="center", ncol=3)
plt.setp(g.ax_heatmap.get_xticklabels(), rotation=90)
plt.subplots_adjust(bottom=0.5)
g.ax_row_dendrogram.set_visible(False)
dendro_box = g.ax_row_dendrogram.get_position()
dendro_box.x0 = (dendro_box.x0 + 2 * dendro_box.x1) / 3
g.cax.set_position(dendro_box)
g.cax.yaxis.set_ticks_position("left")
g.cax.yaxis.set_label_position("left")
plt.tight_layout()
plt.savefig("/tmp/tight_after.png")
plt.cla()
g = sns.clustermap(iris, col_cluster=False, yticklabels=False, row_colors=row_colours, cbar_kws={"label" : "measure"})
for (label, colour) in label_colours.items():
g.ax_col_dendrogram.bar(0, 0, color=colour, label="Iris___________________{}".format(label))
g.ax_col_dendrogram.legend(loc="center", ncol=3)
plt.tight_layout()
plt.setp(g.ax_heatmap.get_xticklabels(), rotation=90)
plt.subplots_adjust(bottom=0.5)
g.ax_row_dendrogram.set_visible(False)
dendro_box = g.ax_row_dendrogram.get_position()
dendro_box.x0 = (dendro_box.x0 + 2 * dendro_box.x1) / 3
g.cax.set_position(dendro_box)
g.cax.yaxis.set_ticks_position("left")
g.cax.yaxis.set_label_position("left")
plt.savefig("/tmp/tight_before.png")
这导致以下几个图表:
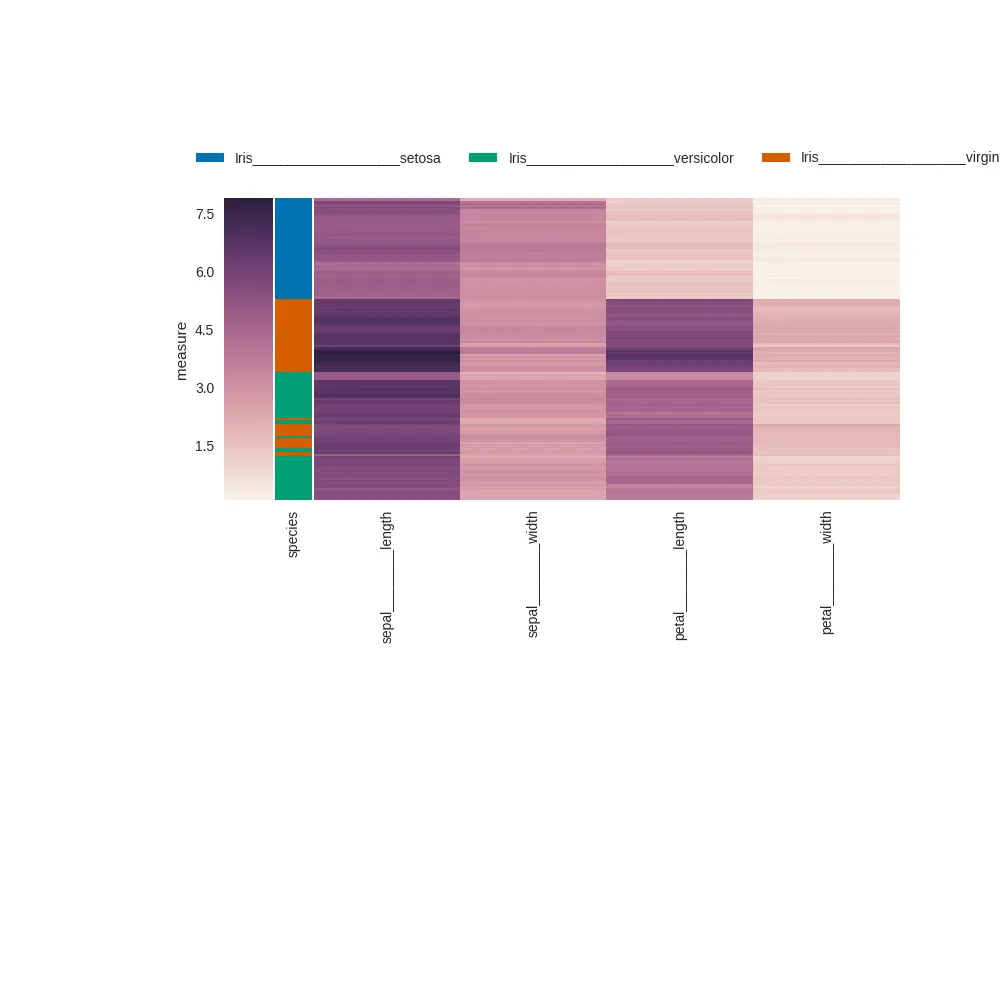
没有使用
plt.tight_layout,右侧的标签被截断 (物种应该是 "virginica"):
在重新定位色条之后调用
plt.tight_layout:
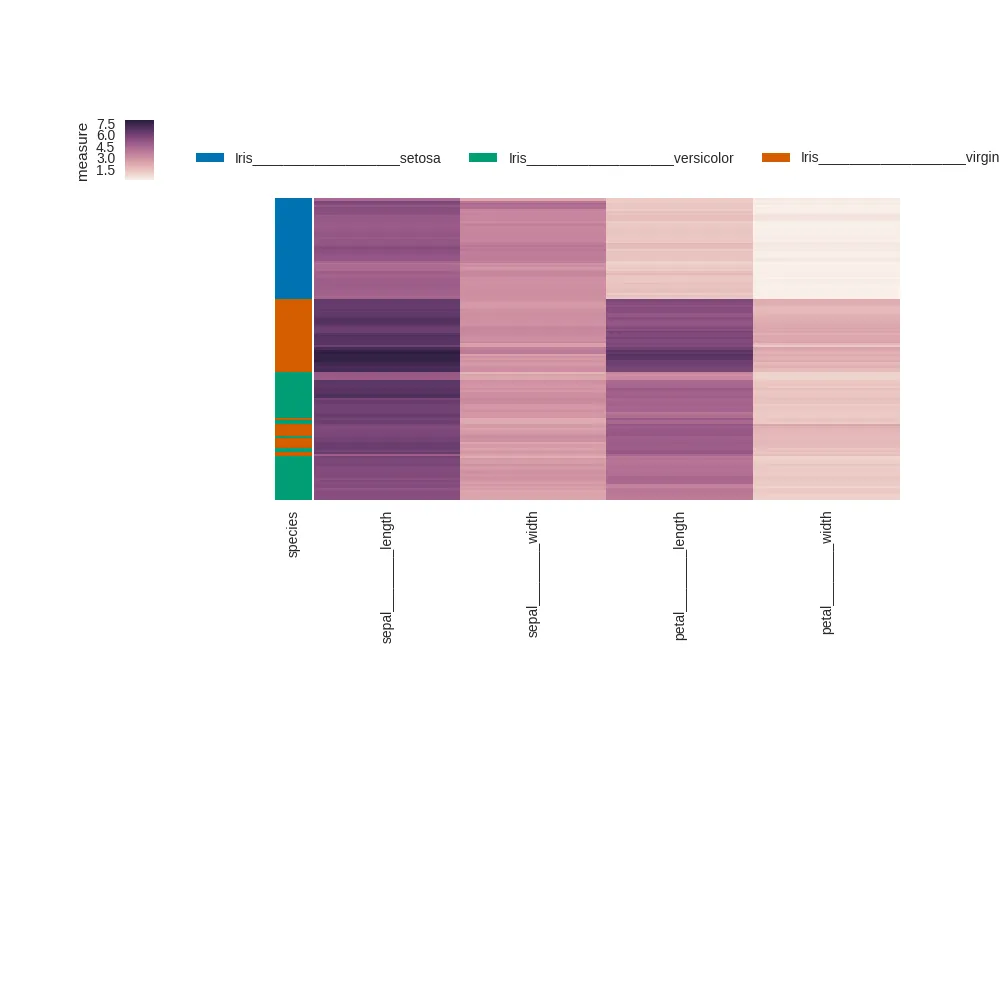
在重新定位色条之前调用
plt.tight_layout:

 有
有 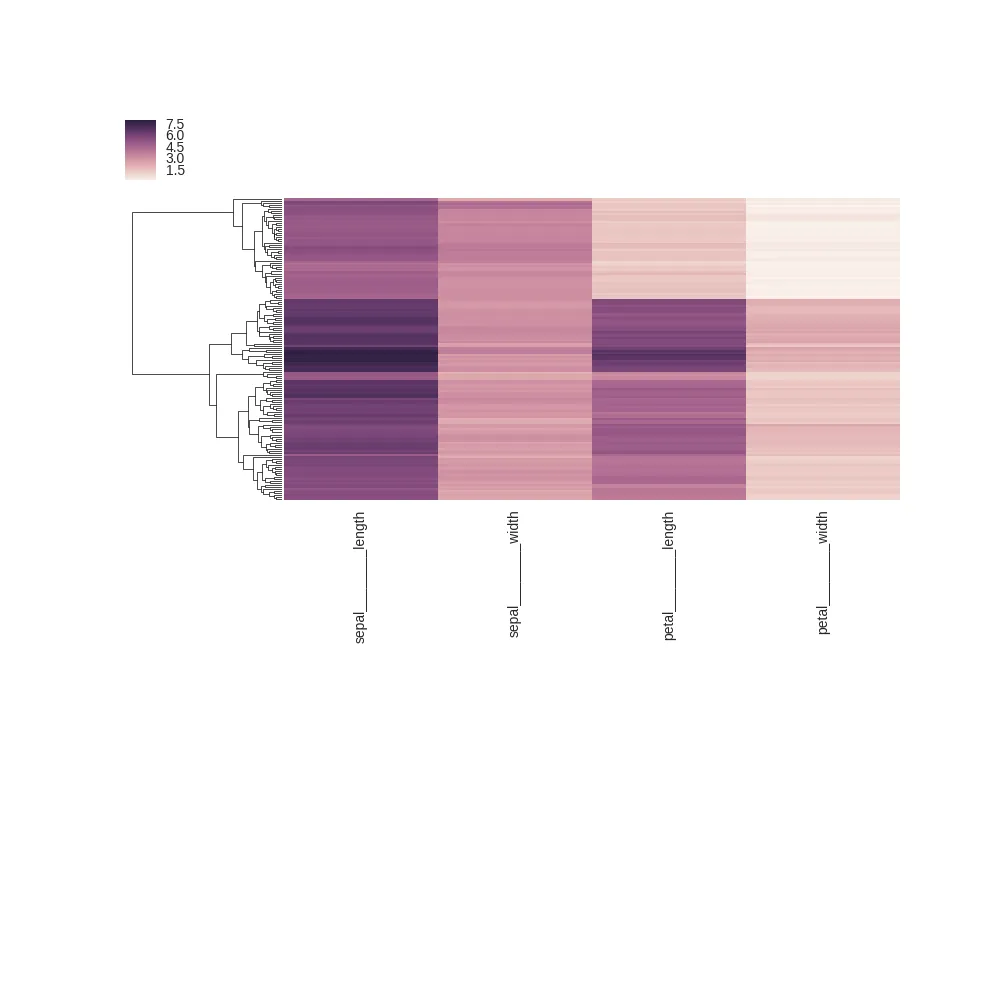 为什么会这样?
subplots_adjust调整子图位置,正如其名称所示,这是可以预期的。难道你不只是想先调整子图,然后再设置条形图的位置吗?改变命令的顺序应该会得到所需的结果。 - ImportanceOfBeingErnest