我正在尝试使用
我的问题是如何通过引用
我尝试在映射中添加
你有更好的想法吗?
在最后一种情况下,我可以自己计算方程系数,然后使用
以下是我的问题的示例代码:
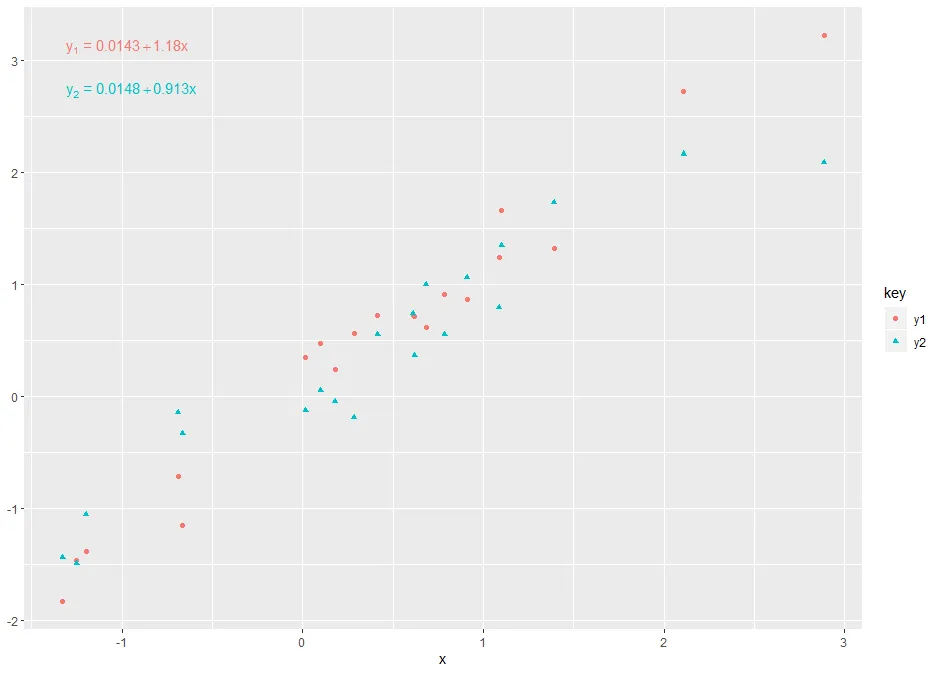
ggpmisc的stat_poly_eq函数在图表上显示方程式。我的问题是如何通过引用
key参数将y=...改为y1=...和y2=...中的值。我尝试在映射中添加
eq.with.lhs参数,但它不能识别该参数。我尝试将向量传递给eq.with.lhs参数,但它重叠了每个方程中的两个元素...你有更好的想法吗?
在最后一种情况下,我可以自己计算方程系数,然后使用
geom_text,但这似乎是解决问题的不太有效的方法。以下是我的问题的示例代码:
data <- data.frame(x = rnorm(20)) %>%
    mutate(y1 = 1.2*x + rnorm(20, sd=0.2),
           y2 = 0.9*x + rnorm(20, sd=0.3)) %>%
    gather(value = value, key = key, -x)

ggplot(data, aes(x = x, y = value)) +
    geom_point(aes(shape = key, colour = key)) +
    stat_poly_eq(aes(label = ..eq.label.., colour = key),
                 formula = y  ~ poly(x, 1, raw = TRUE),
                 eq.x.rhs = "x",
                 # eq.with.lhs = c(paste0(expression(y[1]), "~`=`~"),
                 #                 paste0(expression(y[2]), "~`=`~")),
                 eq.with.lhs = paste0(expression(y[ind]), "~`=`~"),
                 parse = TRUE) +
    ylab(NULL)