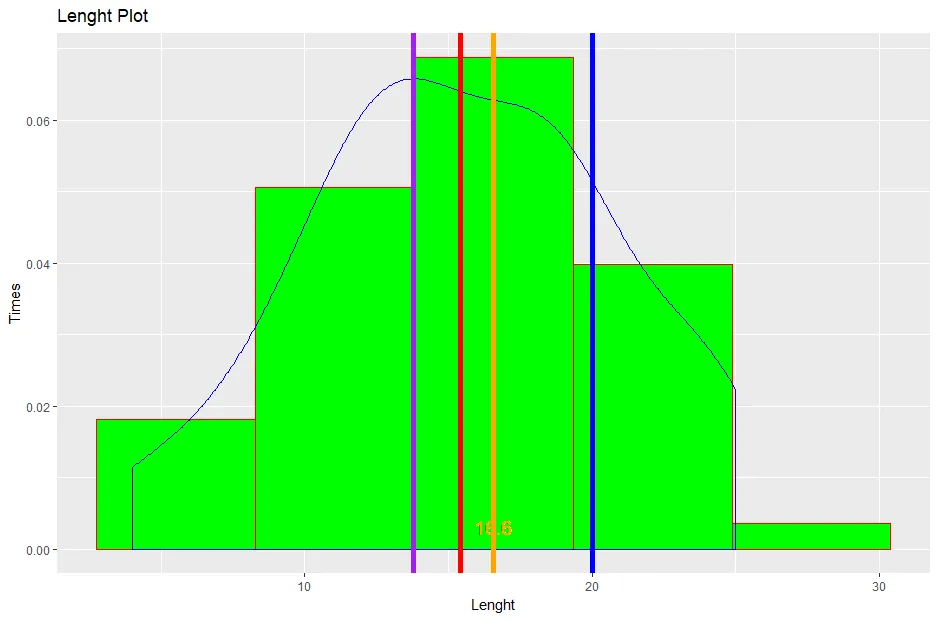
我需要在这些图表中添加平均线和众数的值。我使用它来计算箱子的数量。
bw <- diff(range(cars$lenght)) / (2 * IQR(cars$lenght) / length(cars$lenght)^(1/3))
故事情节:
ggplot(data=cars, aes(cars$lenght)) +
  geom_histogram(aes(y =..density..),
                 col="red",
                 binwidth = bw,
                 fill="green",
                 alpha=1) +
  geom_density(col=4) +
  labs(title='Lenght Plot', x='Lenght', y='Times')

cars$lenght
168.8 168.8 171.2 176.6 176.6 177.3 192.7 192.7 192.7 178.2 176.8 176.8 176.8 176.8 189.0 189.0 193.8 197.0 141.1 155.9 158.8 157.3 157.3 157.3 157.3 157.3 157.3 157.3 174.6 173.2
提前致谢。
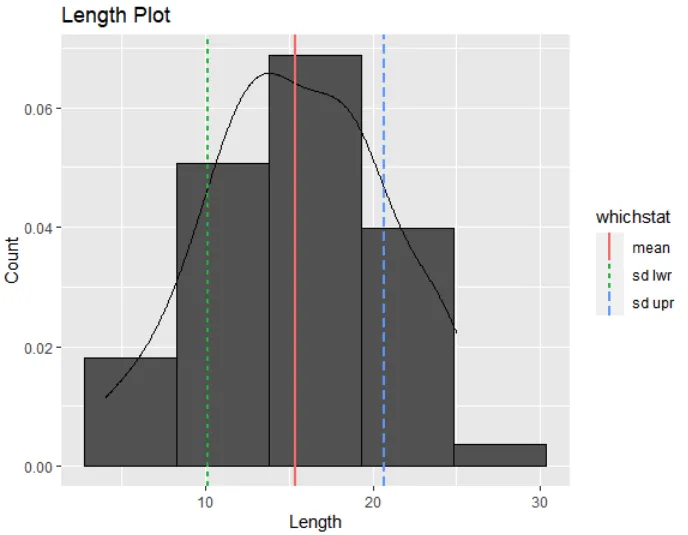
cars$lenght的部分内容吗?另外,我假设你想要cars$lenght的平均线和众数?最后,你想让它们显示为图表上的垂直线吗? - Mike H.+ geom_vline(xintercept=mean(cars$lenght), lwd=1, linetype=2, color="black"),这会在图表中添加一条垂直线,位置为数据集cars中长度列的平均值,线宽为1,线型为虚线,颜色为黑色。 - Marco Sandrimodes包:https://cran.r-project.org/web/packages/modes/modes.pdf - Marco Sandri