如何在 ggplot 中添加连续灰度?

3

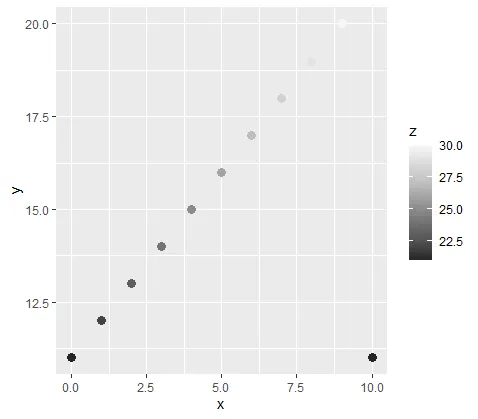
我正在尝试在 ggplot 中为变量 z 添加灰度渐变色图。以下是一个示例,但我还没有找到如何制作连续的灰度比例。

library(ggplot2)

x <- seq(0,10,1)
y <- seq(11,20,1)
z <- seq(21,30,1)

df <- data.frame(cbind(x,y,z))

ggplot(df,aes(x,y))+
  geom_point(aes(color = z), size = 3)+
  scale_color_continuous(type = "viridis")


亲爱的ZT_Geo,我已经提供了一个答案。如果对您有足够的帮助,请点赞并接受该问题的答案。 - LDT
2个回答

6

将颜色轻松地更改为灰度色标的一种方法是使用scale_color_distiller。只需在脚本中用以下行替换scale_color_continuous即可。

scale_color_distiller(type = "seq",
                        direction = -1,
                        palette = "Greys")

plot


实际上,这是一个相当不错的选项;感谢您发布它。 - LDT
太好了,这个完美地运作了!我想点赞,但是我今天刚开户,声望还不够高。 - ZT_Geo

2
# First you set the border of the grey colors
grey_range <- colorRampPalette(c("#737373", "#F0F0F0"))

x <- seq(0,10,1)
y <- seq(11,20,1)
z <- seq(21,30,1)

# Then you set the range of grey colors
color_z <- grey_range(length(z))  

df <- data.frame(cbind(x,y,z))

# Lastly you assign the colors to the factor Z
ggplot(df,aes(x,y, color=as.factor(z)))+
  geom_point(size = 3) +
  scale_color_manual(values=setNames(color_z, levels(df$z))) +
  theme_bw()

enter image description here


这个非常简单的方法就是这样做。
ggplot(df,aes(x,y, color=as.factor(z)))+
  geom_point(size = 3) +
  scale_colour_grey()

# With the start = 0.2, end = 0.8 option you can regulate the intensity and direction of the grey

enter image description here


1
@LTD。非常感谢您的评论和示例。 - ZT_Geo
欢迎 ZT_Geo :)!希望它们对您有用。如果对您有帮助,请点赞或/和接受答案。 - LDT
你可以通过添加以下代码来删除图例,如果不需要的话:ggplot() + theme(legend.position="none") - LDT
你也可以尝试Jonathan的解决方案。如果它有效,请告诉我,我很乐意帮助。 - LDT

网页内容由stack overflow 提供, 点击上面的
可以查看英文原文,
原文链接