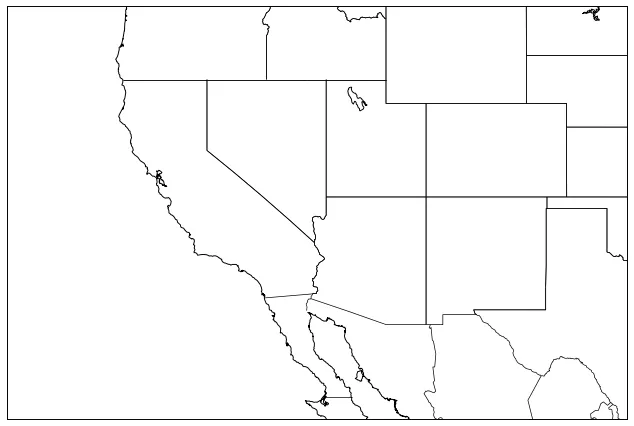
基本上标题说的就是全部。我的drawcounties命令被忽略了,没有任何错误提示。它只会绘制特定的投影吗?文档中并没有说明。
import numpy as np
import matplotlib.pyplot as plt
from mpl_toolkits.basemap import Basemap, shiftgrid
import scipy

def BasemapParameters():
    """
    Sets up basemap.
    """
    m = Basemap(projection='mill', llcrnrlon = 230, llcrnrlat = 27,
                                   urcrnrlat = 45, urcrnrlon = 261,
                                   area_thresh = 1000., resolution='i')
    m.drawcounties(linewidth=0.5)
    m.drawcoastlines(linewidth=0.7)
    m.drawcountries(linewidth=0.5)
    m.drawstates(linewidth=0.5)
    m.drawmapboundary(linewidth=0.7)

def SavePlot(lvl,parameter,region,hour,padding):
    """
    Saves figure to file with given properties
    """
    plt.savefig('{0}_{1}_{2}_{3}.png'.format(lvl,parameter,region,hour),bbox_inches='tight',pad_inches = padding)
    plt.close("all")
    print('  "{0}_{1}_{2}_{3}.png" created.'.format(lvl,parameter,region,hour))

fig = plt.figure()
ax = fig.add_subplot(1,1,1)
BasemapParameters()
SavePlot('sfc','3hrpcp','sw','000',.07)
输出结果: