如何在numpy数组中绘制线条?

25

我希望能够在numpy数组中绘制线条,以获取在线手写识别的离线特征。这意味着我不需要图像,但我需要在numpy数组中绘制一些位置,使其看起来像是给定大小的图像。

我希望能够指定图像大小,然后像这样绘制笔画:

import module
im = module.new_image(width=800, height=200)
im.add_stroke(from={'x': 123, 'y': 2}, to={'x': 42, 'y': 3})
im.add_stroke(from={'x': 4, 'y': 3}, to={'x': 2, 'y': 1})
features = im.get(x_min=12, x_max=15, y_min=0, y_max=111)

有没有简单的方法可以实现这个(最好是使用numpy / scipy直接实现)?

请注意,我想要灰度插值。因此,features 应该是一个取值范围在[0, 255]之间的矩阵。


2
PIL的ImageDraw模块具有与您描述的相似的API。此外,请查看skimage.draw:http://scikit-image.org/docs/dev/api/skimage.draw.html。就此而言,如果需要抗锯齿和/或更高级的绘图方法,甚至可以使用matplotlib进行绘制。 - Joe Kington
@JoeKington 我找的就是line_aa。谢谢!你想要发布答案还是我创建一个社区wiki? - Martin Thoma
Wand提供了一个相当不错的绘图API,但不幸的是它的Numpy转换在2019年仍然无法使用。也就是说,它会混淆宽度和高度,因此您需要np.array(img).reshape(img.height, img.width, 4)。不幸的是,如果使用大于几百像素的像素尺寸,它还会立即崩溃整个Python解释器。我仍在寻找任何合理的现代选项来在Numpy/Torch数组上进行2D绘图。 - Tronic
5个回答

30

感谢Joe Kington提供的答案!我正在寻找skimage.draw.line_aa

import scipy.misc
import numpy as np
from skimage.draw import line_aa
img = np.zeros((10, 10), dtype=np.uint8)
rr, cc, val = line_aa(1, 1, 8, 4)
img[rr, cc] = val * 255
scipy.misc.imsave("out.png", img)

3
请安装scikit-image库,命令为:pip install scikit-image - Ben
1
此外,因为这是第一个谷歌搜索结果。如果你想要别名行,可以使用 skimage.draw.line - evn

26
我在寻找解决方案时偶然发现了这个问题,提供的答案解决得很好。但是,它并不完全适合我的需求,我需要一个“可张量化”的解决方案(即在numpy中实现而不需要显式循环),并且可能带有linewidth选项。最终,我实现了自己的版本,并且由于最终速度比line_aa快得多,所以我想分享一下。

它有两种风味,带和不带linewidth。实际上前者不是后者的泛化,也与line_aa不完全相同,但对于我的目的来说它们就足够好,在图表上看起来也不错。

def naive_line(r0, c0, r1, c1):
    # The algorithm below works fine if c1 >= c0 and c1-c0 >= abs(r1-r0).
    # If either of these cases are violated, do some switches.
    if abs(c1-c0) < abs(r1-r0):
        # Switch x and y, and switch again when returning.
        xx, yy, val = naive_line(c0, r0, c1, r1)
        return (yy, xx, val)

    # At this point we know that the distance in columns (x) is greater
    # than that in rows (y). Possibly one more switch if c0 > c1.
    if c0 > c1:
        return naive_line(r1, c1, r0, c0)

    # We write y as a function of x, because the slope is always <= 1
    # (in absolute value)
    x = np.arange(c0, c1+1, dtype=float)
    y = x * (r1-r0) / (c1-c0) + (c1*r0-c0*r1) / (c1-c0)

    valbot = np.floor(y)-y+1
    valtop = y-np.floor(y)

    return (np.concatenate((np.floor(y), np.floor(y)+1)).astype(int), np.concatenate((x,x)).astype(int),
            np.concatenate((valbot, valtop)))

我称之为“幼稚”,因为它与Wikipedia中的幼稚实现非常相似,但加入了一些抗锯齿,尽管并不完美(例如,会使非常细的对角线)。
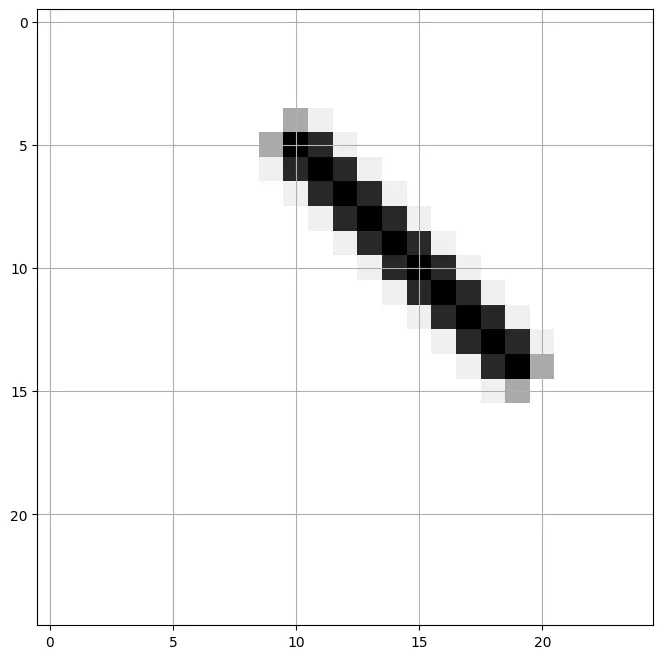
加权版本提供更加明显的抗锯齿,可以得到更粗的线条。
def trapez(y,y0,w):
    return np.clip(np.minimum(y+1+w/2-y0, -y+1+w/2+y0),0,1)

def weighted_line(r0, c0, r1, c1, w, rmin=0, rmax=np.inf):
    # The algorithm below works fine if c1 >= c0 and c1-c0 >= abs(r1-r0).
    # If either of these cases are violated, do some switches.
    if abs(c1-c0) < abs(r1-r0):
        # Switch x and y, and switch again when returning.
        xx, yy, val = weighted_line(c0, r0, c1, r1, w, rmin=rmin, rmax=rmax)
        return (yy, xx, val)

    # At this point we know that the distance in columns (x) is greater
    # than that in rows (y). Possibly one more switch if c0 > c1.
    if c0 > c1:
        return weighted_line(r1, c1, r0, c0, w, rmin=rmin, rmax=rmax)

    # The following is now always < 1 in abs
    slope = (r1-r0) / (c1-c0)

    # Adjust weight by the slope
    w *= np.sqrt(1+np.abs(slope)) / 2

    # We write y as a function of x, because the slope is always <= 1
    # (in absolute value)
    x = np.arange(c0, c1+1, dtype=float)
    y = x * slope + (c1*r0-c0*r1) / (c1-c0)

    # Now instead of 2 values for y, we have 2*np.ceil(w/2).
    # All values are 1 except the upmost and bottommost.
    thickness = np.ceil(w/2)
    yy = (np.floor(y).reshape(-1,1) + np.arange(-thickness-1,thickness+2).reshape(1,-1))
    xx = np.repeat(x, yy.shape[1])
    vals = trapez(yy, y.reshape(-1,1), w).flatten()

    yy = yy.flatten()

    # Exclude useless parts and those outside of the interval
    # to avoid parts outside of the picture
    mask = np.logical_and.reduce((yy >= rmin, yy < rmax, vals > 0))

    return (yy[mask].astype(int), xx[mask].astype(int), vals[mask])

权重调整的确相当任意,因此任何人都可以根据自己的口味进行调整。现在需要rmin和rmax以避免图片外的像素。比较如下:

A comparison is here

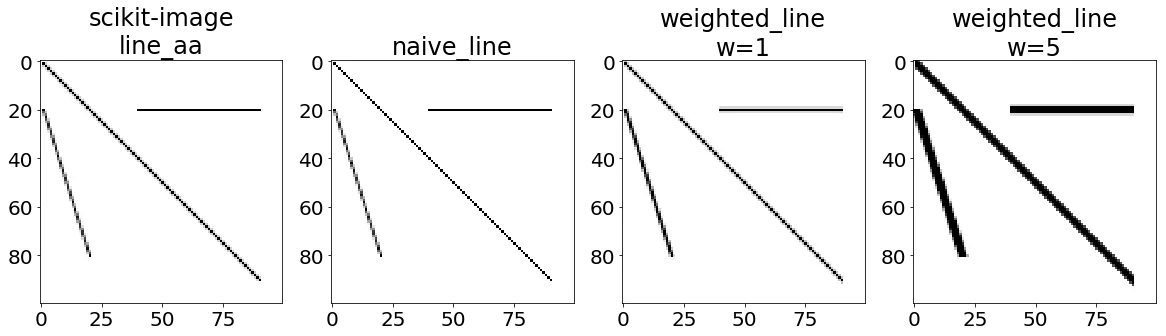
如您所见,即使w=1,weighted_line也稍微粗一些,但以某种均匀的方式;同样,naive_line也略微均匀地变细。

有关基准测试的最后说明:在我的机器上,运行%timeit f(1,1,100,240)来测试各种函数(对于weighted_line,w=1)的结果是,line_aa需要90微秒,weighted_line需要84微秒(当然随着权重的增加时间会增加),而naive_line只需要18微秒。再做比较,将line_aa重新实现为纯Python代码(而不是包中的Cython代码)需要350微秒。


你知道有没有人已经将你的代码与加权线集成到Python库中了吗?否则,我想在scikit-image库中创建一个功能请求,因为这将是一个很酷的功能。 - ced-mos
@ced-mos 我不知道这个,如果你认为这段代码对其他人有用,可以自由地创建此功能请求! - Marco Spinaci
我认为它已经被英伟达研究人员整合到了Instant-NeRF中。 - Bismark Asiedu Asante

8
我发现答案中的val * 255方法不太理想,因为它似乎只在黑色背景上正确工作。如果背景包含较暗和较亮的区域,则这似乎并不完全正确:

enter image description here

要使其在所有背景上正确工作,必须考虑到被抗锯齿线覆盖的像素的颜色。

这里是一个基于原始答案的小演示:

from scipy import ndimage
from scipy import misc
from skimage.draw import line_aa
import numpy as np


img = np.zeros((100, 100, 4), dtype = np.uint8)  # create image
img[:,:,3] = 255                                 # set alpha to full
img[30:70, 40:90, 0:3] = 255                     # paint white rectangle
rows, cols, weights = line_aa(10, 10, 90, 90)    # antialias line

w = weights.reshape([-1, 1])            # reshape anti-alias weights
lineColorRgb = [255, 120, 50]           # color of line, orange here

img[rows, cols, 0:3] = (
  np.multiply((1 - w) * np.ones([1, 3]),img[rows, cols, 0:3]) +
  w * np.array([lineColorRgb])
)
misc.imsave('test.png', img)

有趣的部分是:
np.multiply((1 - w) * np.ones([1, 3]),img[rows, cols, 0:3]) +
w * np.array([lineColorRgb])

新颜色由图像原始颜色和线的颜色通过使用抗锯齿weights值进行线性插值计算而得。以下是一个结果,橙色线在两种不同背景上运行:

enter image description here

现在,在上半部分环绕线的像素变得更暗,而在下半部分像素变得更亮


2

我想要绘制平滑(抗锯齿)的线条,并且不想安装另一个软件包来完成此任务。最终,我使用了Matplotlib的内部方法,该方法可以在我的计算机上以10us/线的速度将1000条线绘制到100x100的数组中。

def rasterize(lines, shape, **kwargs):
    """Rasterizes an array of lines onto an array of a specific shape using
    Matplotlib. The output lines are antialiased.

    Be wary that the line coordinates are in terms of (i, j), _not_ (x, y).

    Args: 
        lines: (line x end x coords)-shaped array of floats
        shape: (rows, columns) tuple-like

    Returns:
        arr: (rows x columns)-shaped array of floats, with line centres being
        1. and empty space being 0.
    """
    lines, shape = np.array(lines), np.array(shape)

    # Flip from (i, j) to (x, y), as Matplotlib expects
    lines = lines[:, :, ::-1]

    # Create our canvas
    fig = plt.figure()
    fig.set_size_inches(shape[::-1]/fig.get_dpi())

    # Here we're creating axes that cover the entire figure
    ax = fig.add_axes([0, 0, 1, 1])
    ax.axis('off')

    # And now we're setting the boundaries of the axes to match the shape
    ax.set_xlim(0, shape[1])
    ax.set_ylim(0, shape[0])
    ax.invert_yaxis()

    # Add the lines
    lines = mpl.collections.LineCollection(lines, color='k', **kwargs)
    ax.add_collection(lines)

    # Then draw and grab the buffer
    fig.canvas.draw_idle()
    arr = (np.frombuffer(fig.canvas.get_renderer().buffer_rgba(), np.uint8)
                        .reshape((*shape, 4))
                        [:, :, :3]
                        .mean(-1))

    # And close the figure for all the IPython folk out there
    plt.close()

    # Finally, flip and reverse the array so empty space is 0.
    return 1 - arr/255.

这是输出的样子:
plt.imshow(rasterize([[[5, 10], [15, 20]]], [25, 25]), cmap='Greys')
plt.grid()

rasterized line example


1
这个程序运行得非常好,而且确实很快。我遇到的唯一问题是由于某些原因无法获取缓冲区。相反,我使用了这里的答案,它有效:https://dev59.com/NWsz5IYBdhLWcg3wj4gc#61443397。 - Dan
另外,由于您正在绘制黑色在白色上的图形,因此仅需使用 R 通道即可,而不是 RGB 的平均值[:, :, :3].mean(-1) -> [:, :, 1]。这样会稍微快一些。 - Dan

0

我想在我的项目中只使用numpy来绘制抗锯齿线条,因此我从scikit-image库中获取了该函数,这里是仅使用numpy的line_aa函数:

def line_aa(r0:int, c0:int, r1:int, c1:int):
    """Generate anti-aliased line pixel coordinates.

    Parameters
    ----------
    r0, c0 : int
        Starting position (row, column).
    r1, c1 : int
        End position (row, column).

    Returns
    -------
    rr, cc, val : (N,) ndarray (int,      )
        Indices of pixels (`rr`, `cc`) and intensity values (`val`).
        ``img[rr, cc] = val``.

    References
    ----------
    .. [1] A Rasterizing Algorithm for Drawing Curves, A. Zingl, 2012
           http://members.chello.at/easyfilter/Bresenham.pdf
    """
    rr = list()
    cc = list()
    val = list()

    dc = abs(c0 - c1)

    dr = abs(r0 - r1)
    err = dc - dr
    err_prime = 0

    c, r, sign_c, sign_r = 0, 0, 0, 0
    ed = 0

    if c0 < c1:
        sign_c = 1
    else:
        sign_c = -1

    if r0 < r1:
        sign_r = 1
    else:
        sign_r = -1

    if dc + dr == 0:
        ed = 1
    else:
        ed = np.sqrt(dc*dc + dr*dr)

    c, r = c0, r0
    while True:
        cc.append(c)
        rr.append(r)
        val.append(np.fabs(err - dc + dr) / ed)

        err_prime = err
        c_prime = c

        if (2 * err_prime) >= -dc:
            if c == c1:
                break
            if (err_prime + dr) < ed:
                cc.append(c)
                rr.append(r + sign_r)
                val.append(np.fabs(err_prime + dr) / ed)
            err -= dr
            c += sign_c

        if 2 * err_prime <= dr:
            if r == r1:
                break
            if (dc - err_prime) < ed:
                cc.append(c_prime + sign_c)
                rr.append(r)
                val.append(np.fabs(dc - err_prime) / ed)
            err += dc
            r += sign_r

    return (np.array(rr, dtype=np.intp),
            np.array(cc, dtype=np.intp),
            1. - np.array(val))

网页内容由stack overflow 提供, 点击上面的
可以查看英文原文,
原文链接