如果我有一个三角形标记,能够控制它的方向吗?我有一系列面,对应它们的顶点,并希望绘制它们的基础地图。我知道在使用Mayavi和tvtk.PolyData时,这是很简单的脚本。但由于我处理的是地图而不是3D对象,事情就有点复杂了。
ps:我正在使用basemap工具制作地图。
如果我有一个三角形标记,能够控制它的方向吗?我有一系列面,对应它们的顶点,并希望绘制它们的基础地图。我知道在使用Mayavi和tvtk.PolyData时,这是很简单的脚本。但由于我处理的是地图而不是3D对象,事情就有点复杂了。
ps:我正在使用basemap工具制作地图。
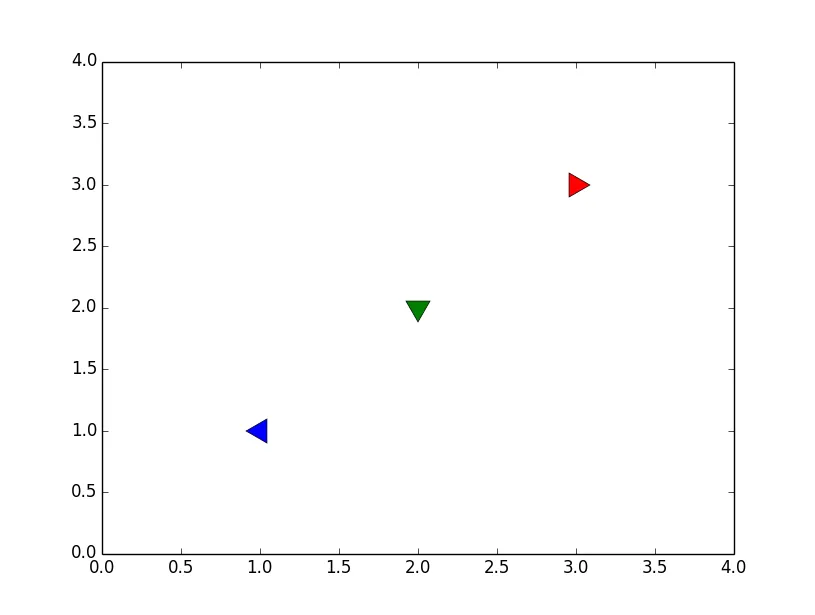
marker并将其传递给包含3个数字的元组(number of sides, style, rotation)来创建自定义多边形。(3, 0, rotation),下面是一个示例。import matplotlib.pyplot as plt
x = [1,2,3]
for i in x:
plt.plot(i, i, marker=(3, 0, i*90), markersize=20, linestyle='None')
plt.xlim([0,4])
plt.ylim([0,4])
plt.show()
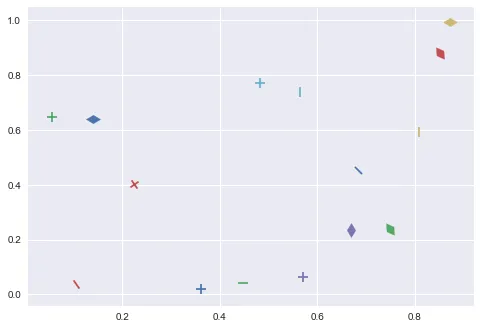
我想添加一个方法来旋转其他非正规多边形标记样式。下面我通过修改标记样式类的变换属性来旋转“细菱形”、“加号”和“垂直线”。
import matplotlib as mpl
import matplotlib.pyplot as plt
import numpy as np

for m in ['d', '+', '|']:

    for i in range(5):
        a1, a2  = np.random.random(2)
        angle = np.random.choice([180, 45, 90, 35])

        # make a markerstyle class instance and modify its transform prop
        t = mpl.markers.MarkerStyle(marker=m)
        t._transform = t.get_transform().rotate_deg(angle)
        plt.scatter((a1), (a2), marker=t, s=100)
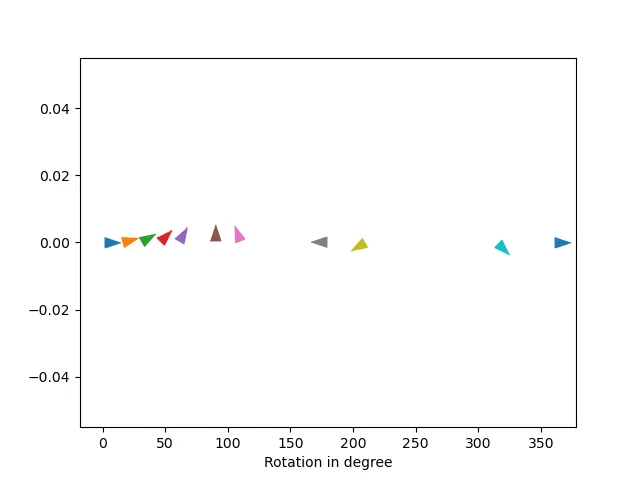
plt.plot 不接受 MarkerStyle 对象,它会抛出一个错误:TypeError: float() argument must be a string or a number, not 'MarkerStyle'。但是 plt.scatter 可以正常工作。 - Henrimatplotlib.path.Path解决方法(不规则三角形)如果您正在寻找一个标记符号,您可以清楚地从[0,2pi)中拒绝方向,您可以构造一个路径标记。 由于路径会自动按绘图例程进行缩放(使得最外部点接触到-1 <= x,y <= 1的框),因此您需要进行额外的点大小缩放。
import numpy as np
import matplotlib as mpl
import matplotlib.pyplot as plt


def gen_arrow_head_marker(rot):
    """generate a marker to plot with matplotlib scatter, plot, ...

    https://matplotlib.org/stable/api/markers_api.html#module-matplotlib.markers

    rot=0: positive x direction
    Parameters
    ----------
    rot : float
        rotation in degree
        0 is positive x direction

    Returns
    -------
    arrow_head_marker : Path
        use this path for marker argument of plt.scatter
    scale : float
        multiply a argument of plt.scatter with this factor got get markers
        with the same size independent of their rotation.
        Paths are autoscaled to a box of size -1 <= x, y <= 1 by plt.scatter
    """
    arr = np.array([[.1, .3], [.1, -.3], [1, 0], [.1, .3]])  # arrow shape
    angle = rot / 180 * np.pi
    rot_mat = np.array([
        [np.cos(angle), np.sin(angle)],
        [-np.sin(angle), np.cos(angle)]
        ])
    arr = np.matmul(arr, rot_mat)  # rotates the arrow

    # scale
    x0 = np.amin(arr[:, 0])
    x1 = np.amax(arr[:, 0])
    y0 = np.amin(arr[:, 1])
    y1 = np.amax(arr[:, 1])
    scale = np.amax(np.abs([x0, x1, y0, y1]))
    codes = [mpl.path.Path.MOVETO, mpl.path.Path.LINETO,mpl.path.Path.LINETO, mpl.path.Path.CLOSEPOLY]
    arrow_head_marker = mpl.path.Path(arr, codes)
    return arrow_head_marker, scale

fig, ax = plt.subplots()
for rot in [0, 15, 30, 45, 60, 90, 110, 180, 210, 315, 360]:

    marker, scale = gen_arrow_head_marker(rot)
    markersize = 25
    ax.scatter(rot, 0, marker=marker, s=(markersize*scale)**2)

ax.set_xlabel('Rotation in degree')

plt.show()
请查看matplotlib.markers模块。其中特别有趣的是,您可以使用任意多边形并指定角度:
marker = (3, 0, 45) # triangle rotated by 45 degrees.
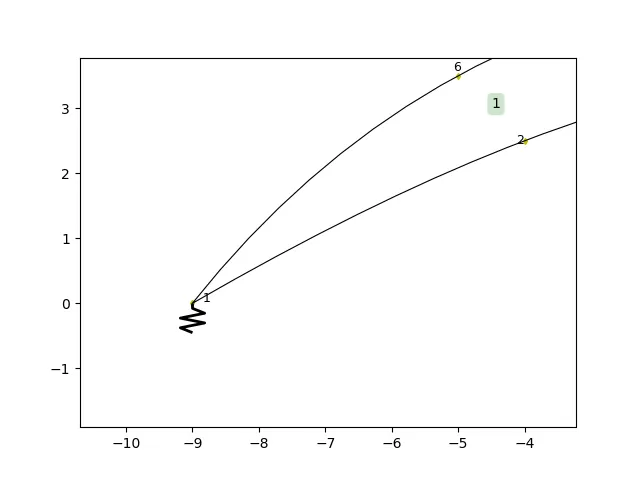
   plt.plot(x,y,
       marker=[(0,-24),(-10,-20),(10,-16),(-10,12),(10,8),(0,-4),(0,0)],
       markersize=42, color='w', linestyle='None',
       markeredgecolor='k', markeredgewidth= 2.)
将创建一个形状为弹簧的标记。大小自动映射到单位正方形,您的点(0,0)将放置在x,y处。 从这里开始,制作一个函数来旋转给定角度的所有坐标列表应该是一项微不足道的任务。
plt.plot(df ['A'],df ['Speed'],marker = (...使用 df ['Direction'] 的某些计算...))。虽然不是很有效率(像这样迭代和绘制 N 个单点),但如果您有与其他行共享的 M 个方向(例如 N、S、E、W),则可以通过方向索引 df,然后绘制这些已索引部分,那么您只需对 M 个不同的方向进行 M 种不同的plt.plot调用即可。 - Ffisegydd