如何在geom_text中为文本标签添加逗号分隔符?

6

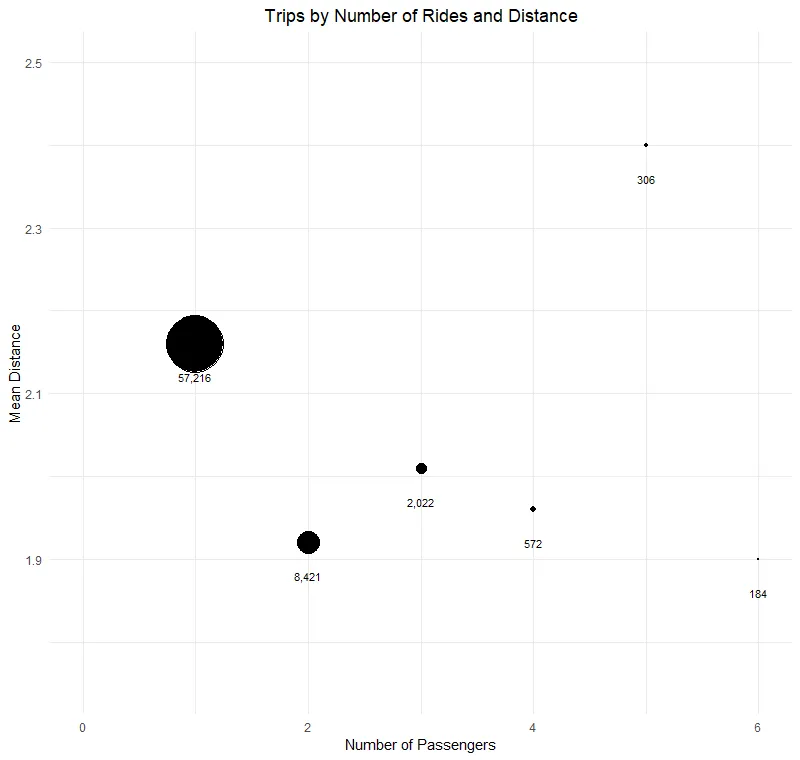
我需要在 geom_text() 中更改数字格式,使其包含逗号。

我查看了相关问题,但无法让那些解决方案起作用。我尝试了 "sep ="、计数/总计数类型以及一些我刚刚抄录而不知道任何意思的代码。在这件事让我发疯之前,我需要一个救援。

以下是我的数据:

 N_PASSENGERS Count Mean_Dist Mean_Time Mean_Fare
         <int> <int>     <dbl>     <dbl>     <dbl>
1            1 57216      2.16     10.2       145.
2            2  8421      1.92      9.21      213.
3            3  2022      2.01      9.67      234.
4            4   572      1.96      9.22      351.
5            5   306      2.40      9.84      505.
6            6   184      1.90      7.63      446.


ggplot(Difference, aes(x = N_PASSENGERS, y = Mean_Dist, size = Count)) + 
  geom_point() + 
  scale_size(range = c(0, 20)) + 
  xlim(0, 6) + 
  ylim(1.75, 2.5) + 
  geom_text(aes(label = Count), 
            size = 3, vjust = 4.2, 
            WHAT THE HELL GOES HERE TO MAKE SOME COMMAS HAPPEN?) +
  theme_minimal() + 
  theme(legend.position = "none") + 
  labs(x = "Number of Passengers", 
       y = "Mean Distance",
       title = "Trips by Number of Rides and Distance") + 
  theme(plot.title = element_text(hjust = .5))

我希望在我的数据点旁边看到像10,000这样的数字。但是我看到的数字是像10000这样的数字。我知道这是一个非常简单的问题,但是我正在尝试学习R语言,所以感谢任何对此的帮助。


那个完美地运行了。非常感谢您抽出时间来帮助! - Jon Robinson
2个回答

11
你可以在geom_text的美学映射aes()中格式化文本标签。
不要这样写:
  ... +
  geom_text(aes(label = Count), size = 3, vjust = 4.2) +
  ...

使用:

  ... +
  geom_text(aes(label = scales::comma(Count)), size = 3, vjust = 4.2) +
  ...

完整的数据和代码:

Difference <- read.table(text = "
                         N_PASSENGERS Count Mean_Dist Mean_Time Mean_Fare
                         1            1 57216      2.16     10.2       145.
                         2            2  8421      1.92      9.21      213.
                         3            3  2022      2.01      9.67      234.
                         4            4   572      1.96      9.22      351.
                         5            5   306      2.40      9.84      505.
                         6            6   184      1.90      7.63      446.")

ggplot(Difference, aes(x = N_PASSENGERS, y = Mean_Dist, size = Count)) + 
  geom_point() + 
  scale_size(range = c(0, 20)) + 
  xlim(0, 6) + 
  ylim(1.75, 2.5) + 
  geom_text(aes(label = scales::comma(Count)), 
            size = 3, vjust = 4.2) +
  theme_minimal() + 
  theme(legend.position = "none") + 
  labs(x = "Number of Passengers", 
       y = "Mean Distance",
       title = "Trips by Number of Rides and Distance") + 
  theme(plot.title = element_text(hjust = .5))

plot


这应该成为采纳的答案。它回答了实际问题!我需要在geom_text()中有逗号,而不是y轴数字(我的主题隐藏了它们)。谢谢! - NaturallyAsh

3

您可以使用 scales 包,该包允许一些格式选项,如 commadollarpercent

df <- data.frame(a=c("a","b","c","d"), b=c(300,1000,2000,4000))
library(ggplot2)
library(scales)
ggplot(df, aes(a, b)) + 
  geom_point(size=4) +
  scale_y_continuous(labels = comma)

plot


1
scales包是答案。非常感谢您抽出时间帮助我。我真的很感激。 - Jon Robinson
@jon-robinson 您好,不用谢。请接受它作为答案并点赞。谢谢。 - mnm
1
这个答案也很有用,因为一旦我把逗号放到geom_text中,我还注意到我也想在y轴标签中加上它们! - George D Girton

网页内容由stack overflow 提供, 点击上面的
可以查看英文原文,
原文链接