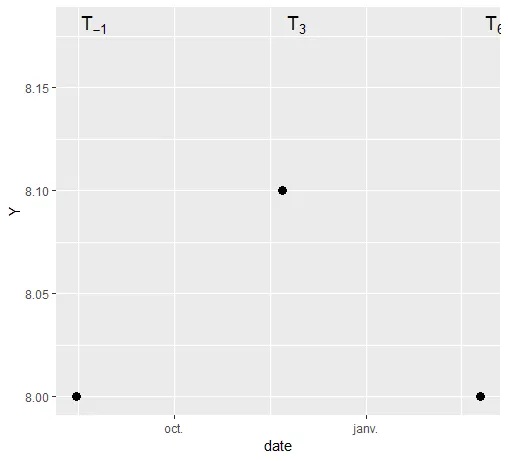
我有一组时间序列的数据,通过时间点进行绘制并分隔开,我想用下标对其进行标记。以下是我用于生成图形和时间点标签的代码。我希望在-1、3和6上加上下标。提前感谢!
timepoints=data.frame(date=as_datetime(c("2016-08-15" ,"2016-11-22",
"2017-02-25")), timepoint=c("T-1", "T3", "T6"))

TimeseriespH = ggplot(FinalSeaphox, aes(x=DTTM)) +
geom_line(aes(y=MpH, color = "Outer Bay", group = grp), size = 0.5) +
geom_line(aes(y=CpH, color = "Inner Bay", group = grp), size = 0.5) +
scale_x_datetime(labels = date_format("%b '%y"), date_breaks = "1
month", limits = as_datetime(c("2016-07-01","2017-04-19"))) +
labs(x = "", y = "pH") +
scale_y_continuous(limits = c(7.4,8.2)) +
geom_vline(xintercept = as_datetime("2016-12-01"), linetype = 2, color
= "black") +
geom_vline(xintercept = as_datetime("2016-08-26"), linetype = 2, color
= "black") +
geom_vline(xintercept = as_datetime("2017-03-06"), linetype = 2, color
= "black") +
geom_text(data=timepoints, mapping=aes(x=date, y=c(8.18, 8.18, 8.18),
label=timepoint), size=5, vjust=-0.4, hjust=0, inherit.aes = FALSE,
color = "black")