我遇到了一个问题,想在我的ggplot图表上添加一个额外的标签。
这是我的数据集:
Group                   Gaze direction  Counts   Duration
Expert Performers       game table      148      1262.122
Expert Performers       objects table   40       139.466
Expert Performers       other           94       371.191
Expert Performers       co-participant  166      387.228
Non-Performers          game table      223      1137.517
Non-Performers          objects table   111      369.26
Non-Performers          other           86       86.794
Non-Performers          co-participant  312      566.438
这是我使用的代码:
这是我正在使用的代码:
ggplot(b, aes(x=Group, y=Gaze.direction))+
  geom_count(mapping=aes(color=Counts, size=Duration))+
  theme_bw()+
  theme(panel.grid.major = element_line(colour = "grey"))+scale_size(range = c(0, 8))+
  scale_colour_gradient(low = "black", high = "gray91")+
  scale_y_discrete(name ="Gaze direction") +
  geom_text(aes(label=Counts,hjust=-1, vjust=-1))
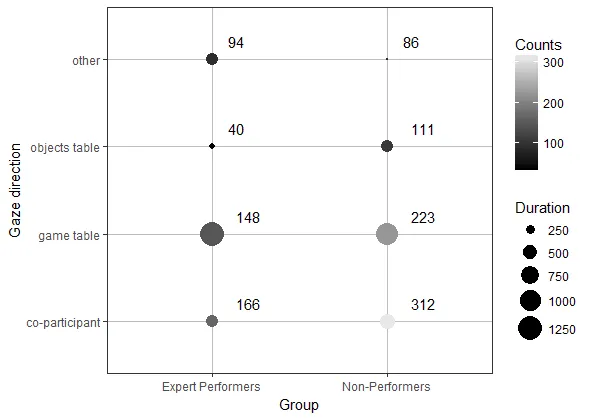
期望的图形应该包含每个数据点的计数数量(已经有了),并且还应该用括号(在图中标为红色)显示持续时间。
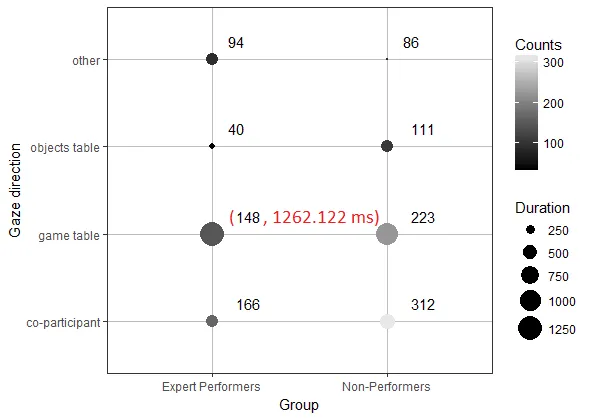
如果有人知道如何修复我的代码,我会非常感激。
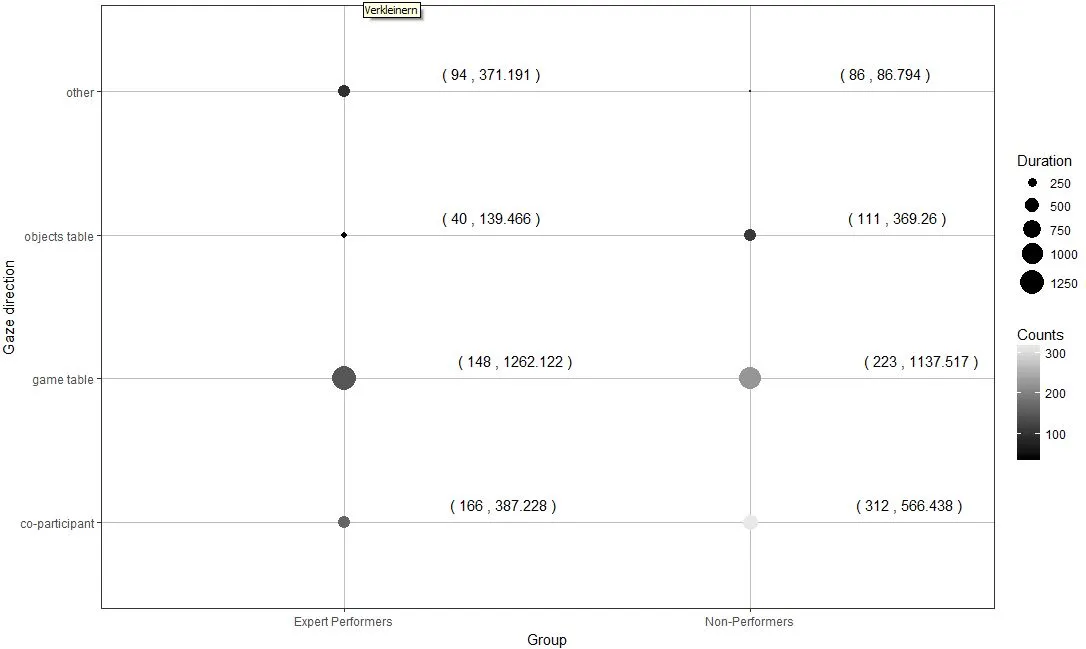
dput输出的问题,这并非故意。下次我会更加注意。非常感谢您提供的解决方案,它看起来正是我想要的样子。 - Jo-Achnams。此外,在括号和计数之间以及其他地方有空格。有没有办法去掉这些空格? - Jo-Achna