使用极坐标在Python中绘制相图

3
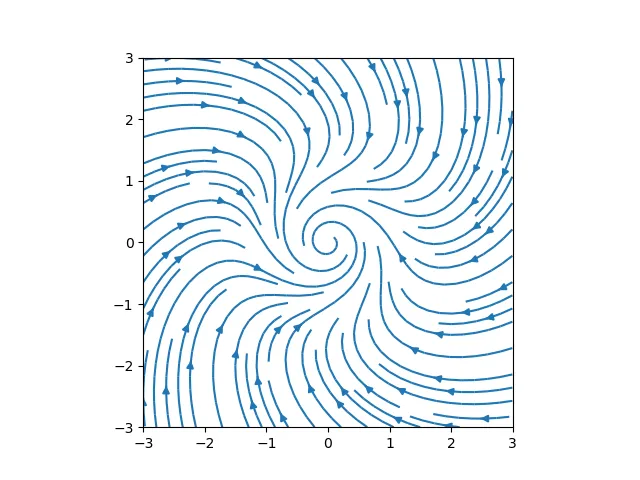
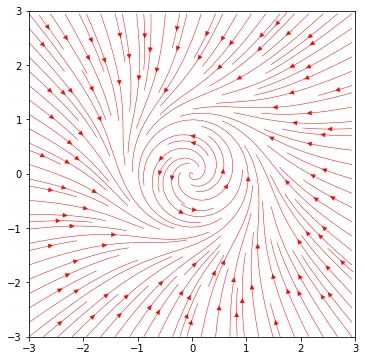
我需要一个相图,展示以下非线性系统的极坐标形式:
\dot{r} = 0.5*(r - r^3) \dot{\theta} = 1
我知道如何在Mathematica中完成...
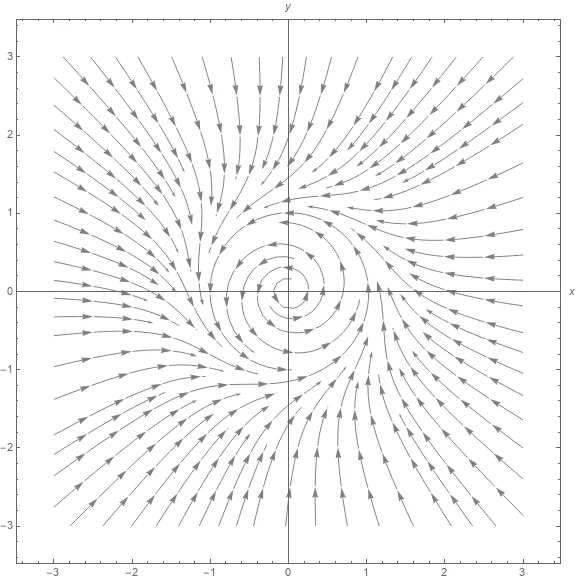
field1 = {0.5*(r - r^3), 1};
p1 = StreamPlot[Evaluate@TransformedField["Polar" -> "Cartesian", field1, {r, \[Theta]} -> {x, y}], {x, -3, 3}, {y, -3, 3}, Axes -> True, StreamStyle -> Gray, ImageSize -> Large];
Show[p1, AxesLabel->{x,y}, ImageSize -> Large]

enter image description here

我该如何在Python中使用pyplot.quiver实现相同效果?

2个回答

5

这只是一个非常朴素的实现,但可能会有所帮助...

import numpy as np
import matplotlib.pyplot as plt

def dF(r, theta):
    return 0.5*(r - r**3), 1

X, Y = np.meshgrid(np.linspace(-3.0, 3.0, 30), np.linspace(-3.0, 3.0, 30))
u, v = np.zeros_like(X), np.zeros_like(X)
NI, NJ = X.shape

for i in range(NI):
    for j in range(NJ):
        x, y = X[i, j], Y[i, j]
        r, theta = (x**2 + y**2)**0.5, np.arctan2(y, x)
        fp = dF(r, theta)
        u[i,j] = (r + fp[0]) * np.cos(theta + fp[1]) - x
        v[i,j] = (r + fp[0]) * np.sin(theta + fp[1]) - y

plt.streamplot(X, Y, u, v)
plt.axis('square')
plt.axis([-3, 3, -3, 3])
plt.show()

enter image description here


你是如何定义变量v和u的?我该如何为其他系统定义变量u和v? - MH.AI.eAgLe

3

更正之前的答案:

  • x=r*cos(theta) 可以得到 dx = dr*cos(theta)-r*sin(theta)*dtheta = x*dr/r-y*dtheta,
  • y=r*sin(theta) 可以得到 dy = dr*sin(theta)+r*cos(theta)*dtheta = y*dr/r+x*dtheta,
  • 可以使用numpy的向量化操作来避免所有循环
def dF(r, theta):
    return 0.5*r*(1 - r*r), 1+0*theta

X, Y = np.meshgrid(np.linspace(-3.0, 3.0, 30), np.linspace(-3.0, 3.0, 30))
R, Theta = (X**2 + Y**2)**0.5, np.arctan2(Y, X)
dR, dTheta = dF(R, Theta)
C, S = np.cos(Theta), np.sin(Theta)
U, V = dR*C - R*S*dTheta, dR*S+R*C*dTheta

plt.streamplot(X, Y, U, V, color='r', linewidth=0.5, density=1.6)
plt.axis('square')
plt.axis([-3, 3, -3, 3])
plt.show()

这将生成下面的图。使用streamplotdensity选项来增加绘图线的密度。

enter image description here


网页内容由stack overflow 提供, 点击上面的
可以查看英文原文,
原文链接