获取二维数组中大于某个值的局部最大值的坐标

38
from PIL import Image
import numpy as np
from scipy.ndimage.filters import maximum_filter
import pylab

# the picture (256 * 256 pixels) contains bright spots of which I wanna get positions
# problem: data has high background around value 900 - 1000

im = Image.open('slice0000.png')
data = np.array(im)

# as far as I understand, data == maximum_filter gives True-value for pixels
# being the brightest in their neighborhood (here 10 * 10 pixels)

maxima = (data == maximum_filter(data,10))
# How can I get only maxima, outstanding the background a certain value, let's say 500 ?

很抱歉,我不太理解 scipy.ndimage.filters.maximum_filter() 函数。有没有一种方法可以仅在斑点内而非背景内获取像素坐标?

http://i.stack.imgur.com/RImHW.png(16位灰度图像,256 * 256像素)

4个回答

66
import numpy as np
import scipy
import scipy.ndimage as ndimage
import scipy.ndimage.filters as filters
import matplotlib.pyplot as plt

fname = '/tmp/slice0000.png'
neighborhood_size = 5
threshold = 1500

data = scipy.misc.imread(fname)

data_max = filters.maximum_filter(data, neighborhood_size)
maxima = (data == data_max)
data_min = filters.minimum_filter(data, neighborhood_size)
diff = ((data_max - data_min) > threshold)
maxima[diff == 0] = 0

labeled, num_objects = ndimage.label(maxima)
slices = ndimage.find_objects(labeled)
x, y = [], []
for dy,dx in slices:
    x_center = (dx.start + dx.stop - 1)/2
    x.append(x_center)
    y_center = (dy.start + dy.stop - 1)/2    
    y.append(y_center)

plt.imshow(data)
plt.savefig('/tmp/data.png', bbox_inches = 'tight')

plt.autoscale(False)
plt.plot(x,y, 'ro')
plt.savefig('/tmp/result.png', bbox_inches = 'tight')

给定 data.png:

enter image description here

以上程序使用threshold = 1500生成了result.png。降低threshold以捕捉更多的局部最大值:

enter image description here

参考文献:


2
你好unutbu,恐怕我不太理解你的解决方案,也就是输出结果。目前为止,我已经成功排除了所有绝对值小于1500的最大值。我只是想看看结果是否令人满意。 - feinmann
很可能是我没有理解你的问题。你是在寻找一种找到最大值的(x,y)坐标的方法吗?如果是这样,你可以使用np.where(maxima) 找到它们。 - unutbu
1
你说得没错,但我想把背景中的局部极大值去掉。就像这样说:只有当局部最大值比其邻域值高出一定值时,它才是一个局部最大值。目前,我通过将所有值低于1500的像素设置为零来取消背景,但我并不是很满意。你知道ImageJ吗?'Find Maxima'功能做得很好,我想要复现这个输出结果。明确一点:我希望在图像上找到亮斑内最亮的像素坐标。 - feinmann

16

现在可以使用skimage完成此操作。

from skimage.feature import peak_local_max
xy = peak_local_max(data, min_distance=2,threshold_abs=1500)

在我的电脑上,对于VGA图像大小,它比上面的解决方案运行速度快4倍,并在某些情况下返回了更准确的位置。


以下是一个在skimage中找寻图像中的“斑点”的好例子/教程:https://scikit-image.org/docs/stable/auto_examples/features_detection/plot_blob.html#sphx-glr-auto-examples-features-detection-plot-blob-py。 - Stefano

13
import numpy as np
import scipy
import scipy.ndimage as ndimage
import scipy.ndimage.filters as filters
import matplotlib.pyplot as plt

fname = '/tmp/slice0000.png'
neighborhood_size = 5
threshold = 1500

data = scipy.misc.imread(fname)

data_max = filters.maximum_filter(data, neighborhood_size)
maxima = (data == data_max)
data_min = filters.minimum_filter(data, neighborhood_size)
diff = ((data_max - data_min) > threshold)
maxima[diff == 0] = 0

labeled, num_objects = ndimage.label(maxima)
xy = np.array(ndimage.center_of_mass(data, labeled, range(1, num_objects+1)))

plt.imshow(data)
plt.savefig('/tmp/data.png', bbox_inches = 'tight')

plt.autoscale(False)
plt.plot(xy[:, 1], xy[:, 0], 'ro')
plt.savefig('/tmp/result.png', bbox_inches = 'tight')

上一篇对我非常有用,但是那个for循环减慢了我的应用程序。我发现ndimage.center_of_mass()可以很好地快速获取坐标...因此提出此建议。


1
感谢这个改进! - unutbu

2

一种快速的numpy方法是填充数组(如果您想考虑边缘),然后比较移动的切片。请参见下面的localMax函数。

import numpy as np
import matplotlib.pyplot as plt

# Generate cloudy noise
Nx,Ny = 100,200
grid = np.mgrid[-1:1:1j*Nx,-1:1:1j*Ny]
filt = 10**(-10*(1-grid**2).mean(axis=0)) # Low pass filter
cloudy = np.abs(np.fft.ifft2((np.random.rand(Nx,Ny)-.5)*filt))/filt.mean()

# Generate checkerboard on a large peak
Nx,Ny = 10,20
checkerboard  = 1.0*np.mgrid[0:Nx,0:Ny].sum(axis=0)%2
checkerboard *= 2-(np.mgrid[-1:1:1j*Nx,-1:1:1j*Ny]**2).sum(axis=0)


def localMax(a, include_diagonal=True, threshold=-np.inf) :
    # Pad array so we can handle edges
    ap = np.pad(a, ((1,1),(1,1)), constant_values=-np.inf )

    # Determines if each location is bigger than adjacent neighbors
    adjacentmax =(
    (ap[1:-1,1:-1] > threshold) &
    (ap[0:-2,1:-1] <= ap[1:-1,1:-1]) &
    (ap[2:,  1:-1] <= ap[1:-1,1:-1]) &
    (ap[1:-1,0:-2] <= ap[1:-1,1:-1]) &
    (ap[1:-1,2:  ] <= ap[1:-1,1:-1])
    )
    if not include_diagonal :
        return np.argwhere(adjacentmax)

    # Determines if each location is bigger than diagonal neighbors
    diagonalmax =(
    (ap[0:-2,0:-2] <= ap[1:-1,1:-1]) &
    (ap[2:  ,2:  ] <= ap[1:-1,1:-1]) &
    (ap[0:-2,2:  ] <= ap[1:-1,1:-1]) &
    (ap[2:  ,0:-2] <= ap[1:-1,1:-1])
    )

    return np.argwhere(adjacentmax & diagonalmax)

plt.figure(1); plt.clf()
plt.imshow(cloudy, cmap='bone')
mx1 = localMax(cloudy)
#mx1 = np.argwhere(maximum_filter(cloudy, size=3)==cloudy) # Compare scipy filter
mx2 = localMax(cloudy, threshold=cloudy.mean()*.8)
plt.scatter(mx1[:,1],mx1[:,0], color='yellow', s=20)
plt.scatter(mx2[:,1],mx2[:,0], color='red', s=5)
plt.savefig('localMax1.png')

plt.figure(2); plt.clf()
plt.imshow(checkerboard, cmap='bone')
mx1 = localMax(checkerboard,False)
mx2 = localMax(checkerboard)
plt.scatter(mx1[:,1],mx1[:,0], color='yellow', s=20)
plt.scatter(mx2[:,1],mx2[:,0], color='red', s=10)
plt.savefig('localMax2.png')

plt.show()

时间与scipy过滤器大致相同:

In [169]: %timeit mx2 = np.argwhere((maximum_filter(cloudy, size=3)==cloudy) & (cloudy>.5))
244 µs ± 1.1 µs per loop (mean ± std. dev. of 7 runs, 1000 loops each)

In [172]: %timeit mx1 = localMax(cloudy, True, .5)                                                                           

每个循环262微秒±1.44微秒(平均值±7次运行的标准差,每个1000次循环)

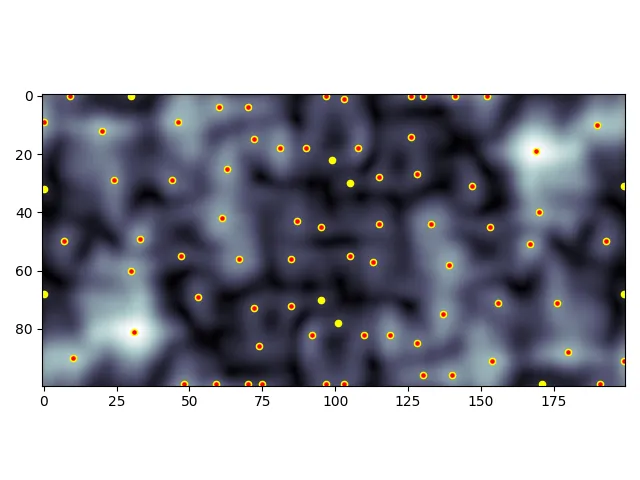
这是带有所有峰值(黄色)和高于阈值峰值(红色)的“多云”示例: cloudy noise with peaks marked

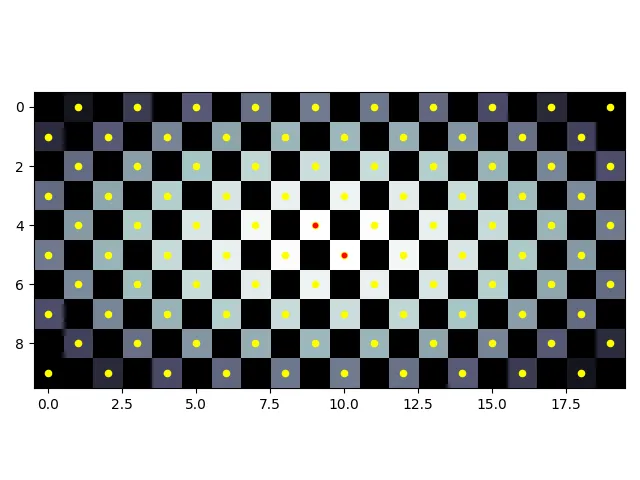
根据您的用例是否包括对角线可能很重要。棋盘演示了不考虑对角线的峰值(黄色)和考虑对角线的峰值(红色): checkerboard with peaks


网页内容由stack overflow 提供, 点击上面的
可以查看英文原文,
原文链接