有一个内置函数argrelextrema可以完成这项任务:
import numpy as np
from scipy.signal import argrelextrema
a = np.array([1,2,3,4,5,4,3,2,1,2,3,2,1,2,3,4,5,6,5,4,3,2,1])
max_ind = argrelextrema(a, np.greater)
r = a[max_ind]
这将为r提供所需的输出。
从SciPy版本1.1开始,您还可以使用find_peaks。以下是两个示例,取自文档本身。
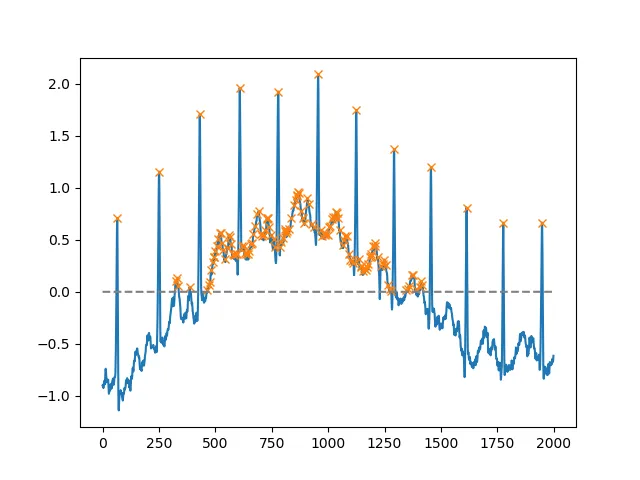
使用height参数,您可以选择所有高于某个阈值的最大值(在此示例中,所有非负最大值;如果必须处理嘈杂的基线,则这可能非常有用;如果要查找极小值,请将输入乘以-1):
import matplotlib.pyplot as plt
from scipy.misc import electrocardiogram
from scipy.signal import find_peaks
import numpy as np

x = electrocardiogram()[2000:4000]
peaks, _ = find_peaks(x, height=0)
plt.plot(x)
plt.plot(peaks, x[peaks], "x")
plt.plot(np.zeros_like(x), "--", color="gray")
plt.show()
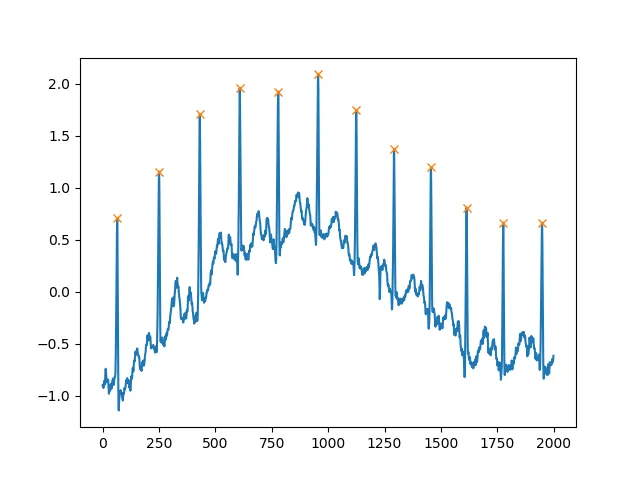
另一个非常有用的参数是distance,它定义了两个峰之间的最小距离:
peaks, _ = find_peaks(x, distance=150)
print(np.diff(peaks))
plt.plot(x)
plt.plot(peaks, x[peaks], "x")
plt.show()
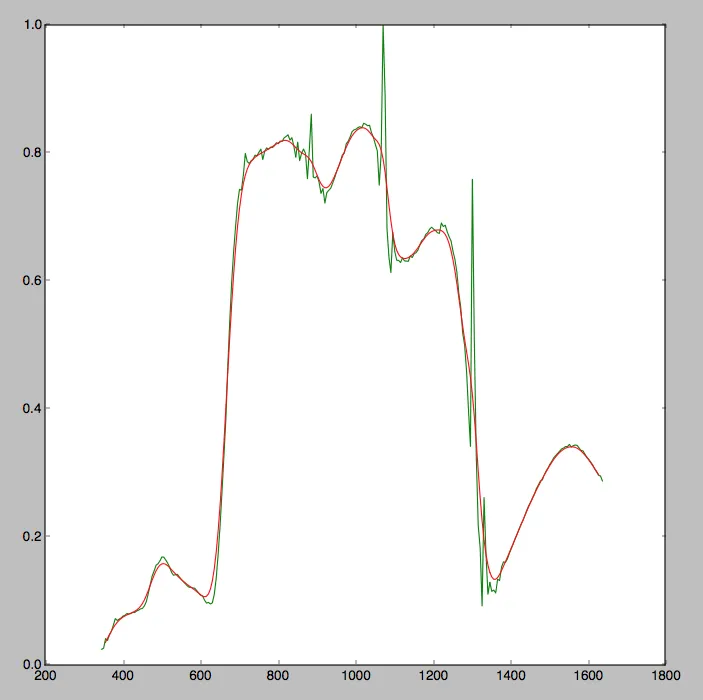
a之间的差异很明显。对于图表数据,我倾向于从数据中减去平滑版本,并通过使用类似于中位数绝对偏差的统计显着峰值进行阈值处理。 - ebarr