我正在生成具有全球范围数据的地图,然后放大到特定区域。在缩放视图中,我想显示边界框外还有其他数据点,方法是从框的中心指向外部数据点的箭头。
注意: 我不需要是“大圆”路径,只需要是Mercator投影中的XY向量,因为我认为这对“正常”绘图也很有用。
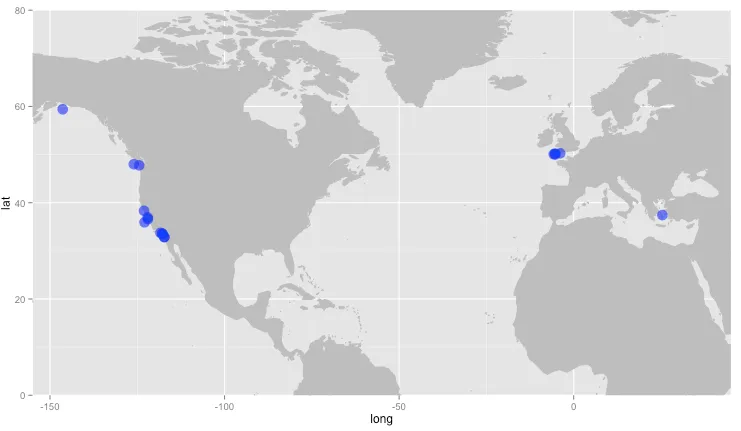
这是一个示例,显示了数据范围的世界地图:
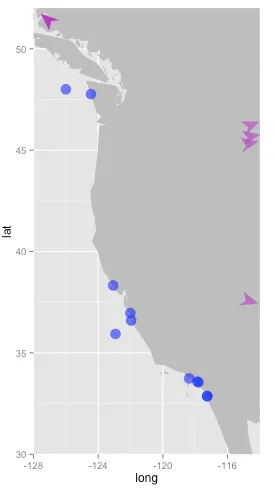
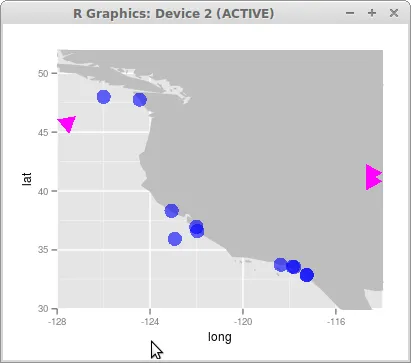
这是缩放视图,手动添加品红色箭头以显示我要生成的内容。
以下是我用于生成这两个基本图形的代码和数据。我需要的是一种生成箭头的方法。
require(ggplot2)

te = structure(list(lat = c(33.7399, 32.8571, 50.2214, 36.96263, 33.5835,
33.54557, 47.76147, 48, 59.40289, 35.93411, 32.87962, 38.3241,
50.03844, 37.44, 50.07774, 50.26668, 36.5944), lng = c(-118.37608,
-117.25746, -5.3865, -122.00809, -117.86159, -117.79805, -124.45055,
-126, -146.35157, -122.931472, -117.25285, -123.07331, -5.26339,
25.4, -5.709894, -3.86828, -121.96201)), .Names = c("lat", "lng"
), class = "data.frame", row.names = c(NA, -17L))

all_states = map_data("world")

# world version:
wp = ggplot() +
      geom_polygon(data = all_states, aes(x = long, y = lat, group = group), colour = "gray",
                   fill = "gray") +
      coord_cartesian(ylim = c(0, 80), xlim = c(-155, 45)) +
      geom_point(data = te, aes(x = lng, y = lat), color = "blue", size = 5,alpha = 0.6)

print(wp)

#states plot
sp = ggplot() +
      geom_polygon(data = all_states, aes(x = long, y = lat, group = group), colour = "gray", fill = "gray") +
      coord_cartesian(ylim = c(30, 52), xlim = c(-128, -114)) +
      geom_point(data = te, aes(x = lng, y = lat), color = "blue", size = 5, alpha = 0.6)

print(sp)
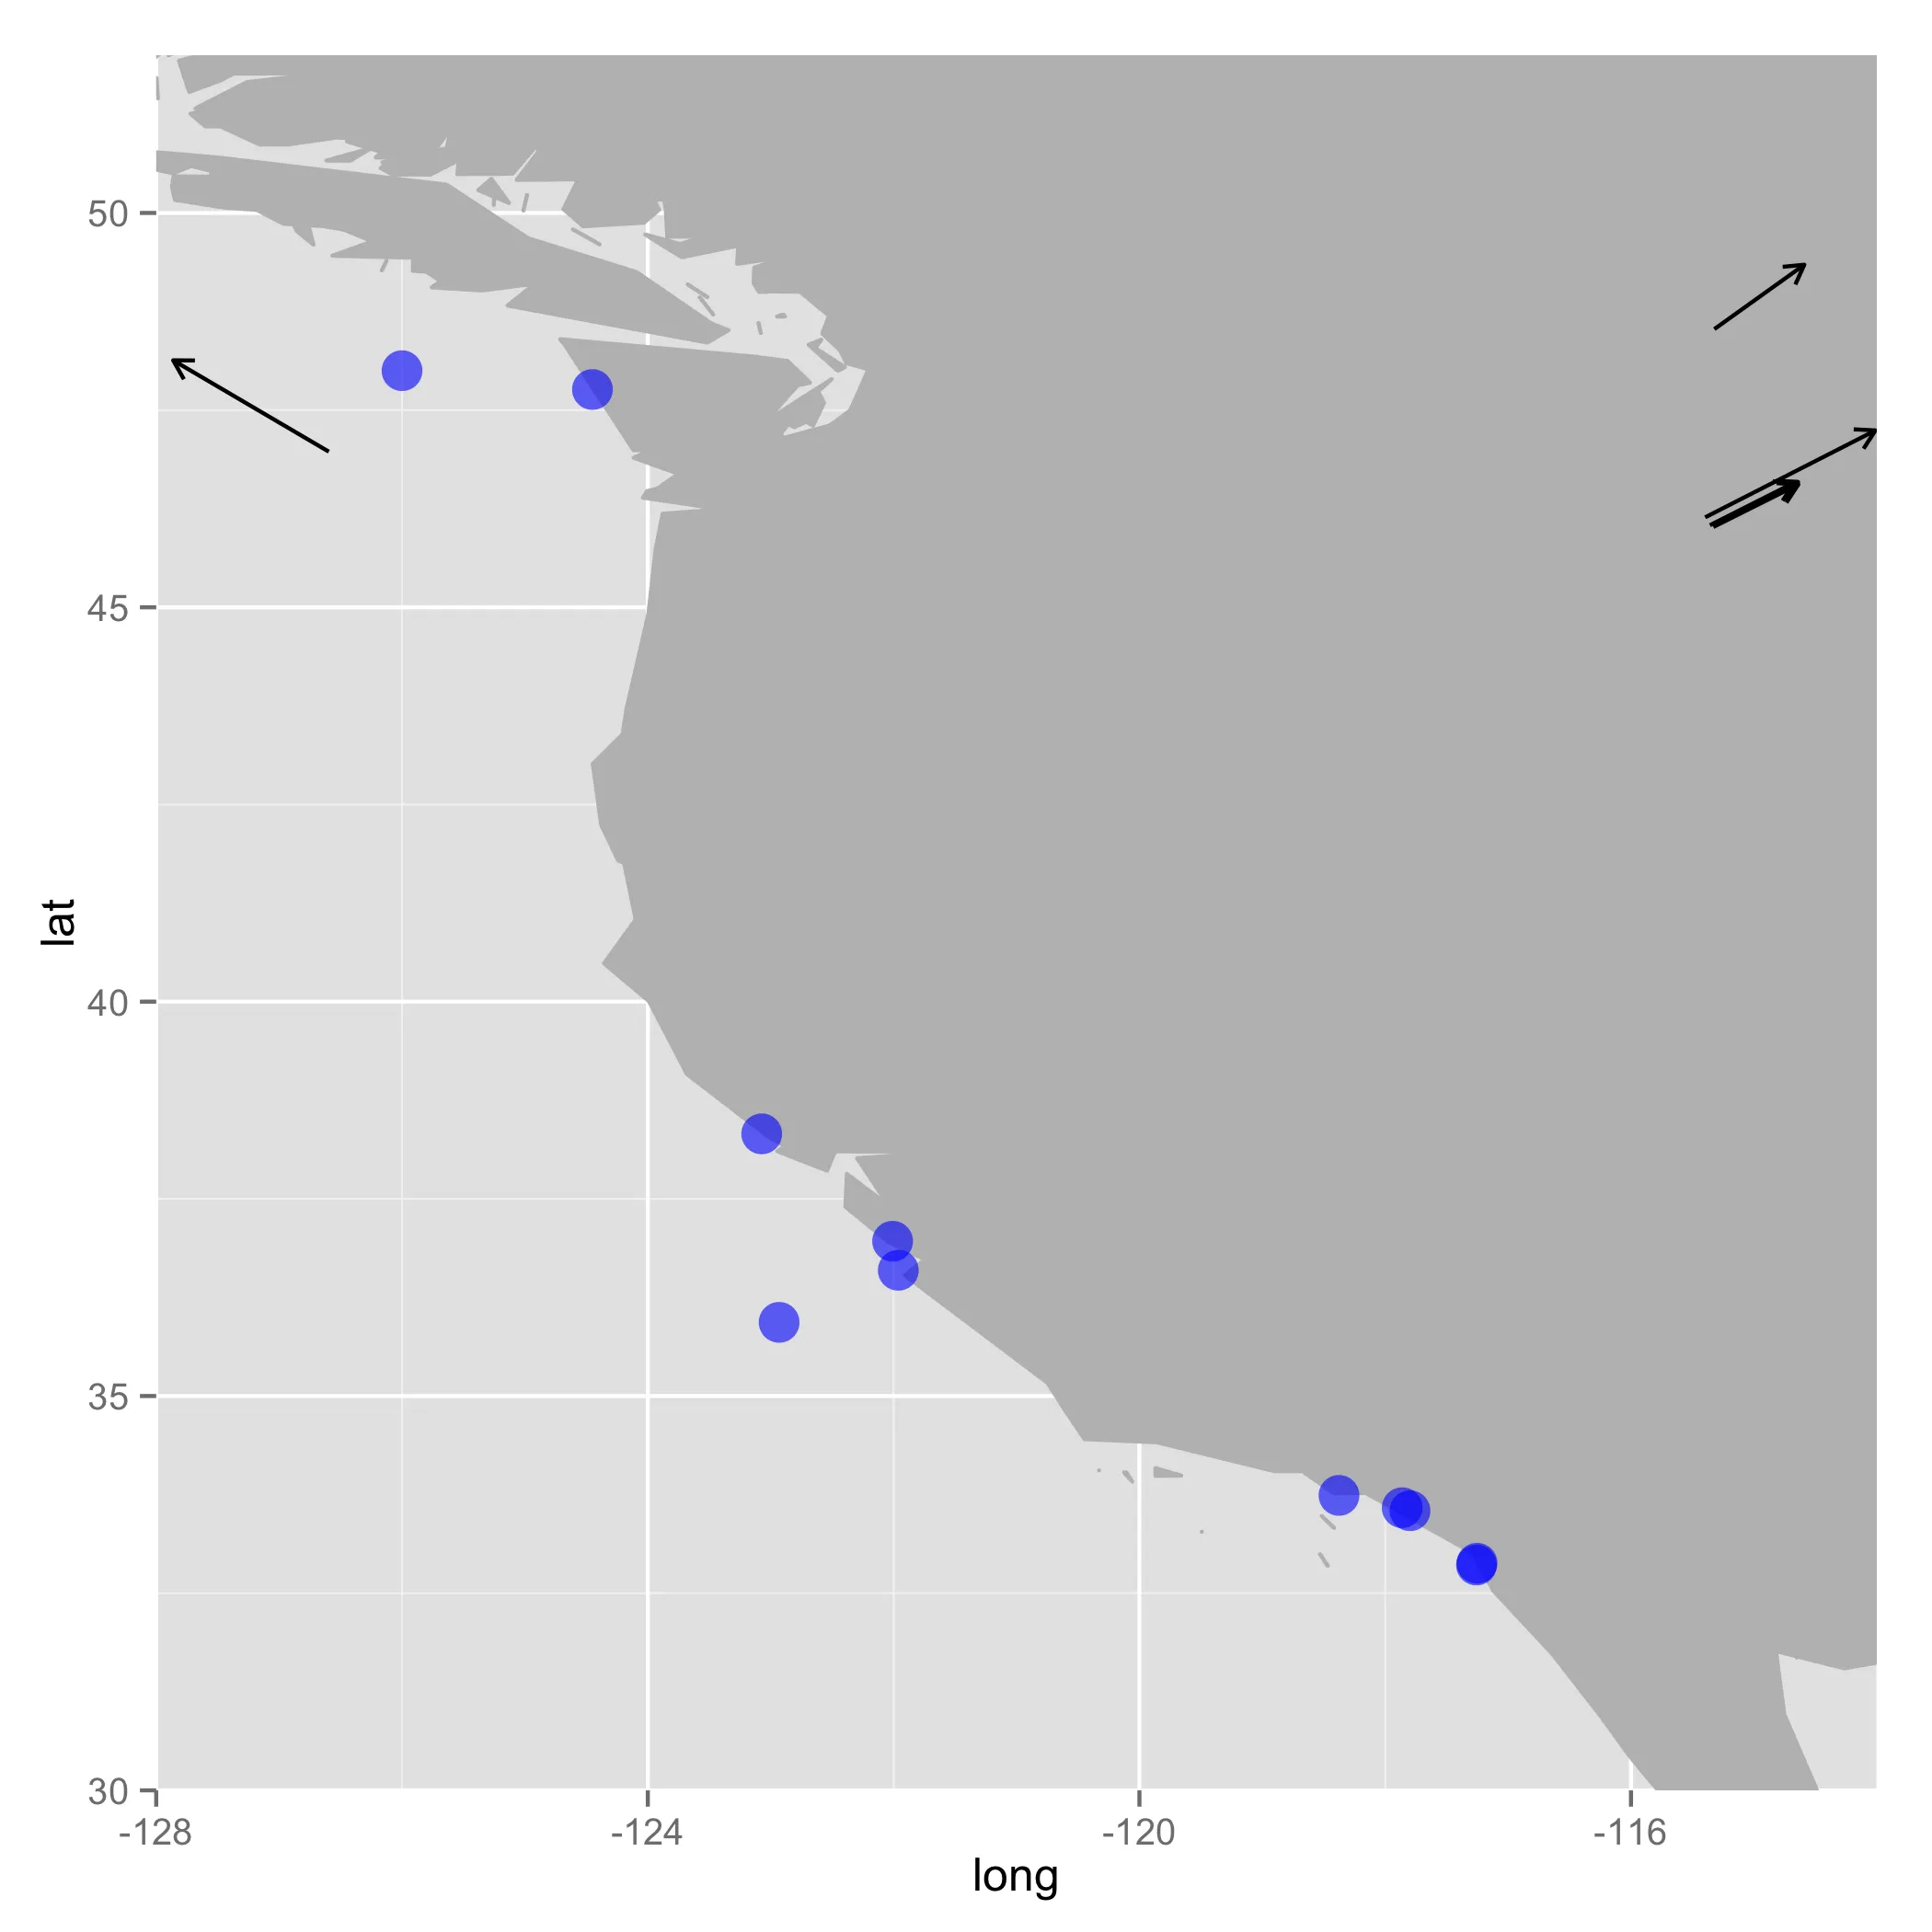
geom_segment层,它们提供可选的箭头,并且在足够小的距离下,它是唯一可见的东西。 - baptiste