我正在使用geom_path函数在R中绘制一些路径。 我希望将我正在绘制的数据转换为GeoTiff(其中包括投影和纬度经度角的地理空间组件),以便我可以导入到NASA WorldWind中。
我引用的工件在这里可用:
- ne_110m_admin_0_countries - HYP_LR_SR_W 我制作了一个非常简单的示例来说明我的情况和我的目标。
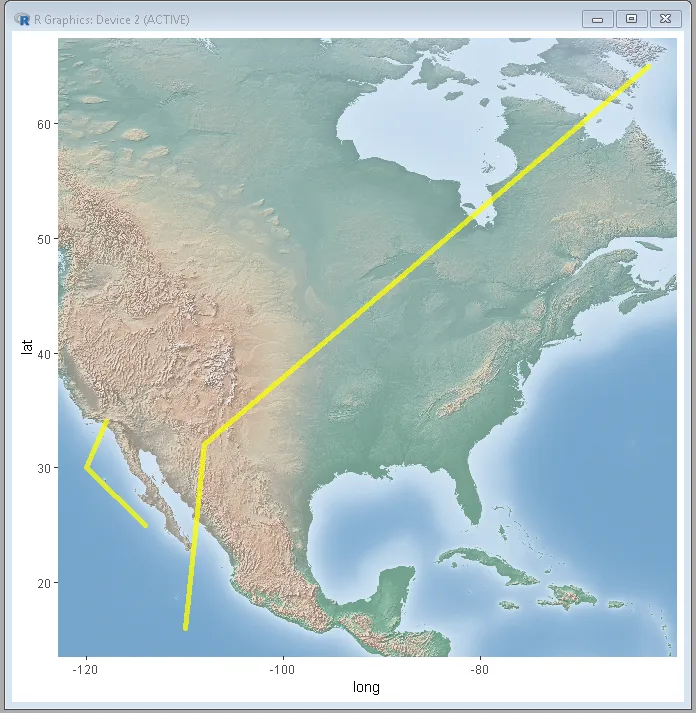
这将产生以下图表:
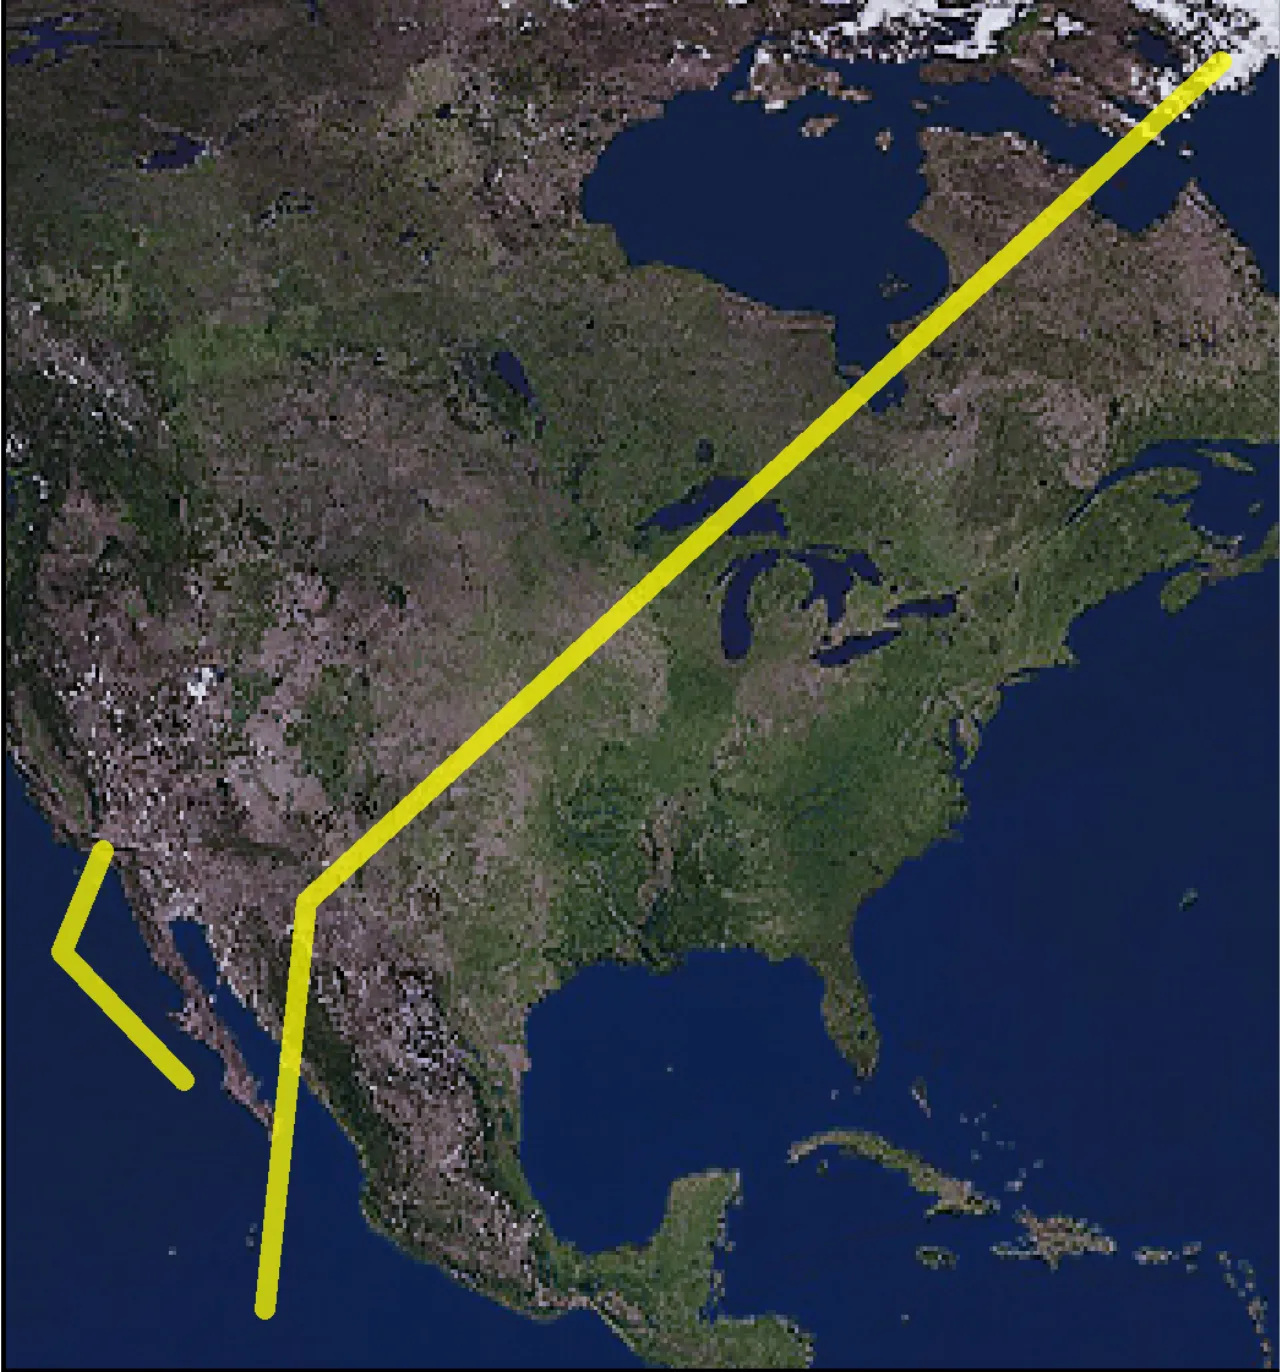
我认为知道了在拥有堆叠光栅的情况下创建所需格式的GeoTIFF的命令,但我无法弄清楚如何将其连接起来,以便从路线获取仅包含图像本身和包含地理空间组件的GeoTIFF。
我引用的工件在这里可用:
- ne_110m_admin_0_countries - HYP_LR_SR_W 我制作了一个非常简单的示例来说明我的情况和我的目标。
library(rgdal)
library(ggplot2)
library(png)
library(raster)
library(tiff)


wrld <- readOGR("data" , "ne_110m_admin_0_countries")
base <- ggplot(wrld, aes(x = long, y = lat))


myDataFrame <- data.frame(Name=c("Object1","Object1","Object1","Object2","Object2","Object2"), lat=c(34,30,25,65,32,16), long=c(-118,-120,-114,-63,-108,-110))


route <- c(geom_path(aes(long, lat, group = myDataFrame$Name), colour = "#ffff00", size = 2, data =
myDataFrame, alpha = 0.75,
lineend = "round"))


earth <- readTIFF("HYP_LR_SR_W.tif")


pathPlot <- base +  annotation_raster(earth, -180, 180, -90, 90) + route
plot(pathPlot)
这将产生以下图表:
我认为知道了在拥有堆叠光栅的情况下创建所需格式的GeoTIFF的命令,但我无法弄清楚如何将其连接起来,以便从路线获取仅包含图像本身和包含地理空间组件的GeoTIFF。
ggsave(plot=pathPlot, "pathPlot.tiff", device = "tiff")
stackedRaster <- stack("pathPlot.tiff")
xRange <- ggplot_build(pathPlot)$layout$panel_params[[1]][c("x.range")]
yRange <- ggplot_build(pathPlot)$layout$panel_params[[1]][c("y.range")]
extent(stackedRaster) <- extent(xRange$x.range[1],xRange$x.range[2], yRange$y.range[1],yRange$y.range[2])
projection(stackedRaster) <- CRS("+proj=longlat +datum=WGS84")
writeRaster(stackedRaster, "myGeoTiff.tiff", options="PHOTOMETRIC=RGB", datatype="INT1U", overwrite=TRUE)
ggplot_build(pathPlot)?你可以使用ggplot_build(pathPlot)$data[[2]]来获取x-y数据。 - Taher A. Ghaleb