我希望创建一个模板,可以让我创建一条股票价格折线图,并能够添加指向特定日期的箭头。 ggplot2的注释功能不允许随着图表的比例调整大小。是否有任何解决方法?
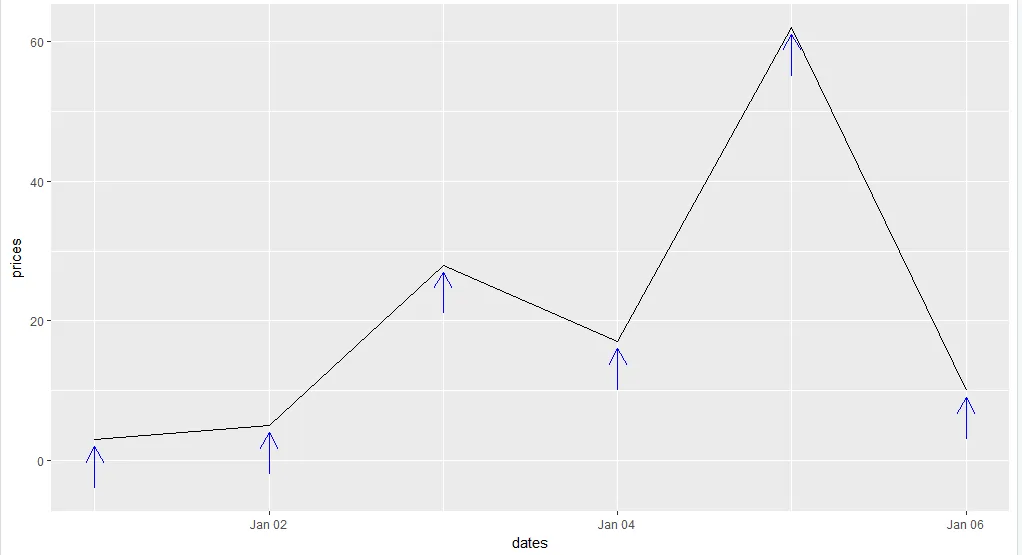
例如,在此仅包含6个日期的情节中,箭头与图表的大小相匹配:
例如,在此仅包含6个日期的情节中,箭头与图表的大小相匹配:
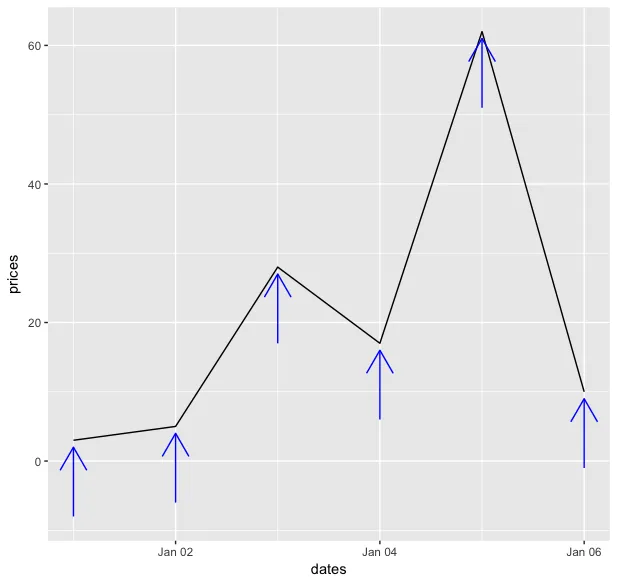
prices<-c(3,5,28,17,62,10)
prices2<-prices-1
prices3<-prices-11
dates<-seq.Date(from=as.Date("2018-1-1"),to=as.Date("2018-1-6"),"days")

ggplot()+
geom_line(aes(dates,prices))+
annotate(
"segment",
x=dates,
xend=dates,
y=prices3,
yend=prices2,
color="blue",
arrow=arrow(length=unit(0.5,"cm")
            ))
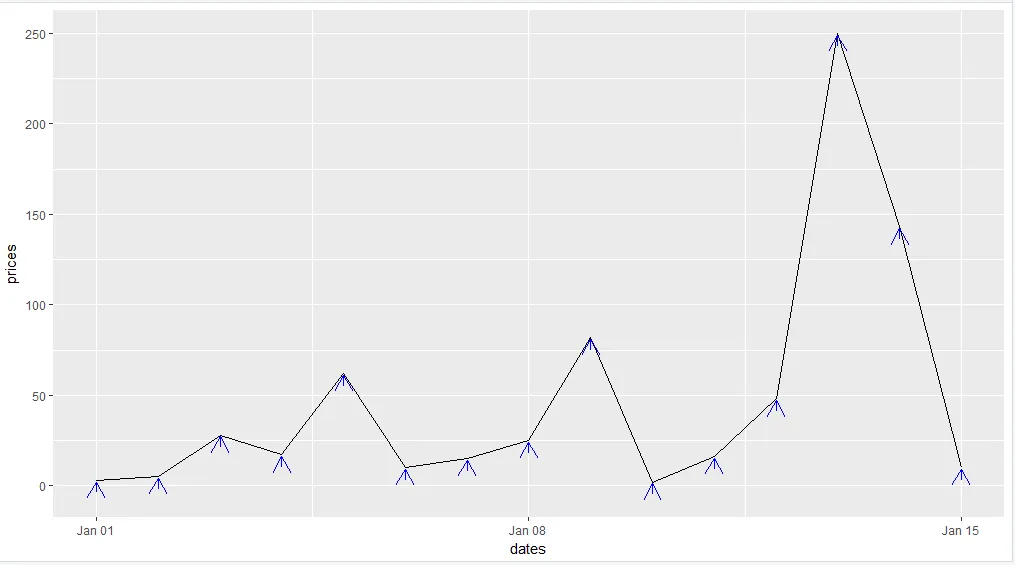
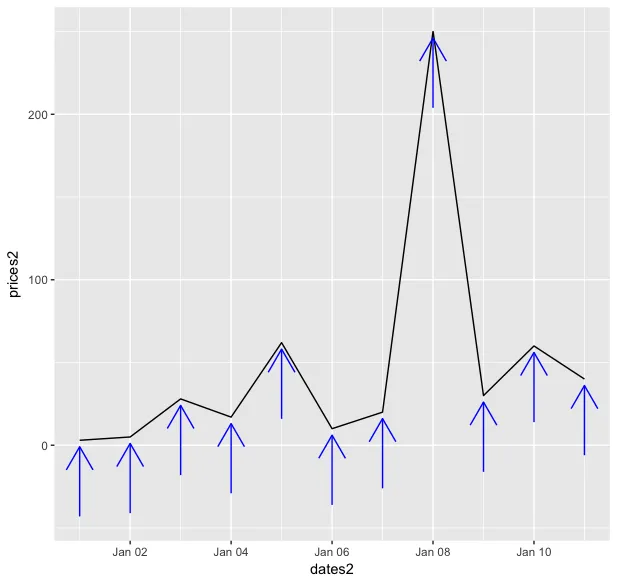
然而,当我将周期增加到15天时,箭头比例不成比例,看起来像这样:
prices<-c(3,5,28,17,62,10)- TG_01prices<-c(3,5,28,17,62,10) prices2<-prices-1 prices3<-prices-11 dates<-seq.Date(from=as.Date("2018-1-1"),to=as.Date("2018-1-6"),"days")- TG_01