这里的复杂问题在于,尽管
colorkey=参数与
legend=参数非常相似,但它并不完全支持与
legend=相同的所有定位选项。而图例可以直接放置在绘图的左侧、右侧、顶部、底部和内部,
colorkey=只支持前四个。
一个相当干净的解决方法是从一次
spplot()调用中提取由
colorkey参数列表准备好的内容,并通过第二个
spplot()调用的
legend=参数传递该内容。
colorkey=“知道”如何准备颜色键对象,而
legend=知道如何在绘图中绘制任意对象,因此我们可以将两者结合起来获得我们想要的结果:
library(sp)
library(grid)
library(lattice)
data(meuse.grid)
gridded(meuse.grid)=~x+y
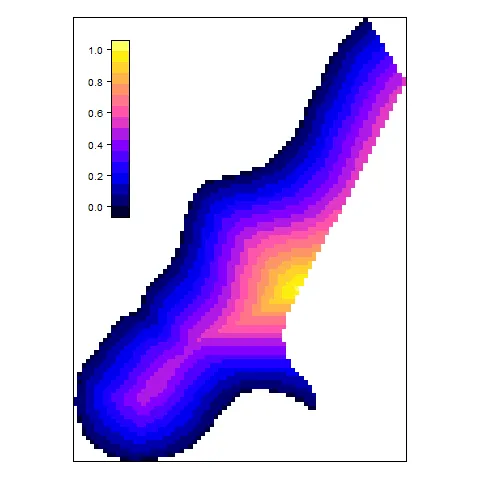
SP <- spplot(meuse.grid[,'dist'],
colorkey = list(space = "left", height = 0.4)
)
args <- SP$legend$left$args$key
legendArgs <- list(fun = draw.colorkey,
args = list(key = args),
corner = c(0.05,.75))
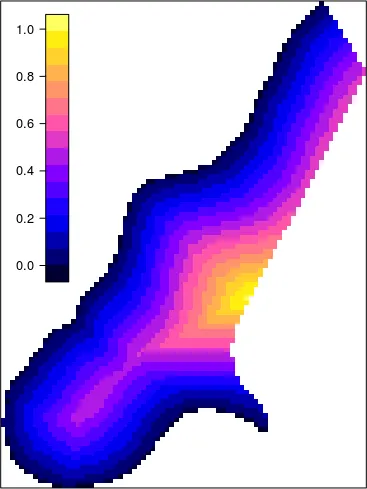
spplot(meuse.grid[,'dist'], colorkey = FALSE,
legend = list(inside = legendArgs))
注意: colorkey=不支持“inside”选项似乎不是设计选择,而只是包作者尚未实现必要代码的问题。作为证据,请参见?lattice::levelplot中colorkey=的文档(其中一个被?sp::spplot引导到)。
colorkey: logical specifying whether a color key is to be drawn
          alongside the plot, or a list describing the color key. The
          list may contain the following components:

          ‘space’: location of the colorkey, can be one of ‘"left"’,
              ‘"right"’, ‘"top"’ and ‘"bottom"’.  Defaults to
              ‘"right"’.

          ‘x’, ‘y’: location, currently unused

          ‘corner’: Interacts with x, y; currently unimplemented

key.space的corner参数一样的可能性? - Tomasdraw.colorkey()的代码中没有看到类似于corner参数的内容,因此我决定单独创建和绘制关键字。位置由key$framevp决定,它是一个gridviewport。我相信有一种适当的方法来定位它,但我仍然觉得它们很难理解和使用。 - Backlinspplot()的"legend="参数传递参数和指令来避开视口参数的低级黑客攻击,从而调用draw.colorkey()。 - Josh O'Brien