在条形图中调整图例位置

3
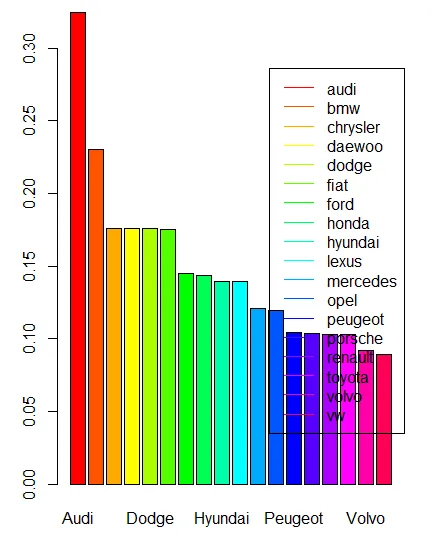
我需要调整下面的条形图的图例位置,将其放在绘图区外的合适位置。
COLORS=rainbow(18)
barplot(sort(task3_result$respondents_share,decreasing = TRUE), main="Share of respondents that mentioned brand among top 3 choices ", names.arg=task3_result$brand, col = COLORS)
legend("right", tolower(as.character(task3_result$brand)), yjust=1,col = COLORS, lty=c(1,1) )

enter image description here


1
请提供一个可复现的例子。 - DatamineR
你试过使用“topright”而不是“right”吗? - mtoto
https://dev59.com/IG865IYBdhLWcg3wNLw7 - user2957945
2个回答

2
感谢各位,我无法解决问题,但是通过使用ggplot达到了我的目标。
windows(width = 500, height= 700)
ggplot(data = task3_result, aes(x = factor(brand), y = respondents_share, fill = brand)) + 
geom_bar(colour = 'black', stat = 'identity') + scale_fill_discrete(name = 'brands') + coord_flip()+
ggtitle('Share of respondents that mentioned brand among top 3 choices') +xlab("Brands") + ylab("Share of respondents")

enter image description here


1
正如DatamineR指出的那样,您的代码不能直接复制(我们没有“task3_result”),但是通过调整“legend()”中的“x”和“y”参数,您可能可以实现您所说的内容 - 例如,您可以将“x”坐标设置为超出条形图边缘的某些位置。请参阅文档:https://stat.ethz.ch/R-manual/R-devel/library/graphics/html/legend.html。还要注意“cex”参数,因为该图例可能比您想要的更加臃肿。
请注意,您必须指定较大的绘图窗口以留出图例的空间;相关的帮助文件是“plot.window”:https://stat.ethz.ch/R-manual/R-devel/library/graphics/html/plot.window.html
虽然你不需要直接调用 plot.window 函数——最好通过 barplot() 函数传递相关参数。如果这没有意义,我建议你更全面地了解 R 的基本绘图包。

网页内容由stack overflow 提供, 点击上面的
可以查看英文原文,
原文链接