使用ggvis R在线图中创建次要Y轴

13

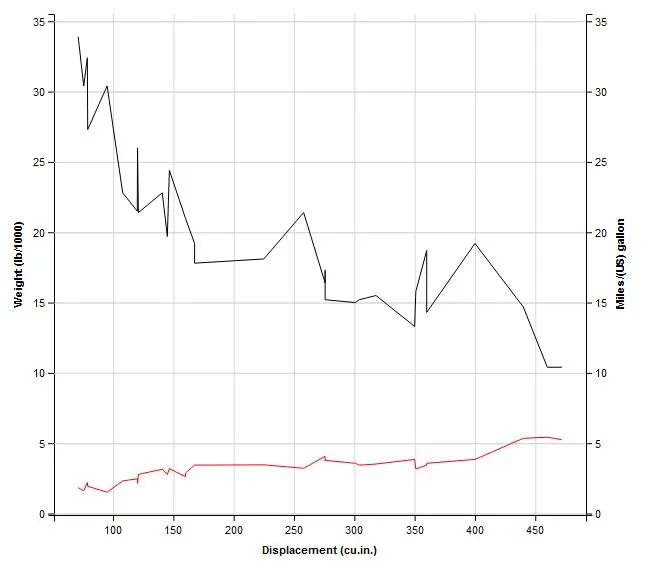
这是我用R中的ggvis包目前为止所做出来的。

    mtcars %>% ggvis(x = ~disp) %>% 
    layer_lines(y = ~wt, stroke := "red") %>%
    layer_lines(y = ~mpg) %>%
    add_axis("y", orient = "left", title = "Weight (lb/1000)") %>%
    add_axis("y", orient = "right", title= "Miles/(US) gallon") %>%
    add_axis("x", title = "Displacement (cu.in.)")

我无法让左侧的Y轴表示wt比例数据。

这是输出结果:

在此输入图片描述

1个回答

12

我假设你想要左侧y轴(即wt)除以1000:

library(dplyr) #you need this library
mtcars  %>% mutate(wt_scaled=wt/1000)  %>% ggvis(x = ~disp) %>% #use mutate from dplyr to add scaled wt
  layer_lines(y = ~wt_scaled, stroke := "red") %>% #use new column
  add_axis("y", orient = "left", title = "Weight (lb/1000)" ,title_offset = 50) %>% #fix left axis label
  scale_numeric("y", domain = c(0, 0.006), nice = FALSE) %>% #align the ticks as good as possible
  add_axis("y", 'ympg' , orient = "right", title= "Miles/(US) gallon" , grid=F ) %>% #remove right y axis grid and name axis
  layer_lines( prop('y' , ~mpg,  scale='ympg') ) %>% #use scale to show layer_lines which axis it should use
  add_axis("x", title = "Displacement (cu.in.)"  )

我认为这就是你想要的:

在此输入图像描述

编辑:

如果你只想在左y轴上绘制wt(不太清楚),那么请执行mutate(wt_scaled=wt/1)(或删除mute)并将domain更改为domain = c(1.5, 5.5)


网页内容由stack overflow 提供, 点击上面的
可以查看英文原文,
原文链接