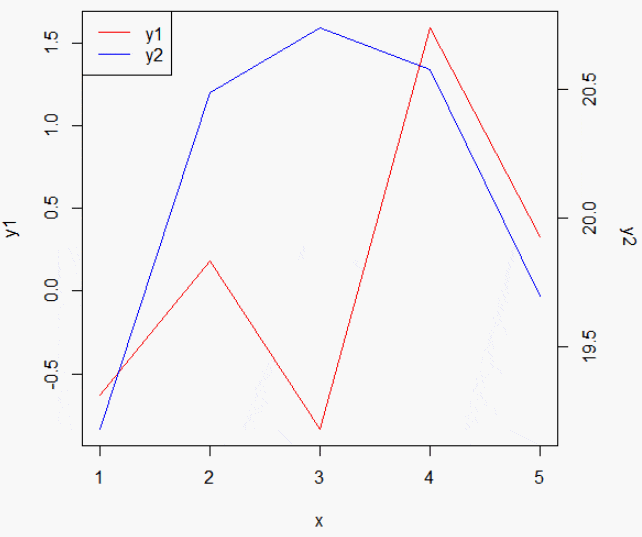
我创建了第二个Y轴,并使用
我的虚拟数据源自于:http://robjhyndman.com/hyndsight/r-graph-with-two-y-axes/
mtext 放置了一个标签。然而,我无法弄清楚如何旋转我的第二个Y标签来面对绘图,就像我的 红色Y2标签 一样?我的虚拟数据源自于:http://robjhyndman.com/hyndsight/r-graph-with-two-y-axes/
x <- 1:5
y1 <- rnorm(5)
y2 <- rnorm(5,20)
par(mar=c(5,4,4,5)+.1)
plot(x,y1,type="l",col="red")
par(new=TRUE)
plot(x, y2,,type="l",col="blue",xaxt="n",yaxt="n",xlab="",ylab="")
axis(4)
mtext("y2",side=4,line=3)
legend("topleft",col=c("red","blue"),lty=1,legend=c("y1","y2"))
结果:
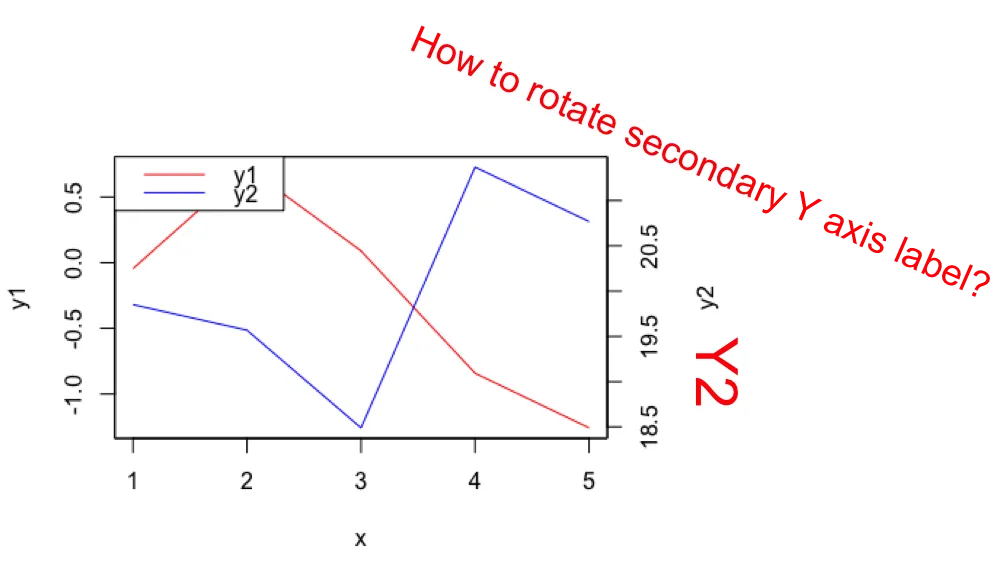
我尝试过srt = ...和las = ...,但都不起作用。
我不一定需要使用mtext,请问是否有其他简单的解决方案?
谢谢!