从梯形概率密度函数中创建样本。

3
我将我的概率密度函数定义如下:
def trapezoidal_pdf(x, a, b, c, d):
    const = (2 / (d + c - a - b))
    
    if a <= x < b:
        probability = const * (x - a) / (b - a)
        return probability
    elif b <= x < c:
        probability = const
        return probability
    elif c <= x < d:
        probability = const * (d - x) / (d - c)
        return probability
    else:
        return 0.0  # Outside the defined range, probability is 0

怎样从PDF中获取样本,以便在绘制直方图时呈现梯形的形状?
我尝试使用`np.random.random`,但我觉得那不是我想要的。
1
你的问题得到解答了吗? - undefined
很抱歉,SeverinPappadeux,我没有答案。如果你有答案,请告诉我。 - undefined
这是你在找的吗? - undefined
1个回答

1

好的,让我快速尝试一下,按照https://en.wikipedia.org/wiki/Trapezoidal_distribution的方法。

你可以查看分布的概率密度函数(PDF)和累积分布函数(CDF),其中有三个明显的部分 - 第一个三角形、中间的矩形框、最后一个三角形。你可以在第一步中决定从哪个部分进行抽样,然后从该部分的分布中进行抽样。中间部分很简单,只是一个缩放后的均匀分布,而侧面的三角形也不难。

以下是示例代码,未经优化,使用的是Python 3.11 Win x64版本。

import numpy as np
import matplotlib.pyplot as plt

def select_part(abcd, rv: np.float64) -> int:
    a, b, c, d = abcd
    
    den = 1.0/(d + c - a - b)
    
    a1 = (b-a)*den
    a2 = 1.0 - (d - c)*den
    a3 = 1.0
    
    if rv <= a1:
        return 1
    
    if rv <= a2:
        return 2
    
    if rv <= a3:
        return 3
    
    return -1 # just in case, should never happen

def sample_trap(abcd, rv1: np.float64, rv2: np.float64) -> np.float64:
    a, b, c, d = abcd
    
    part = select_part(abcd, rv1)
    
    if part == 1:
        return a + np.sqrt(rv2)*(b - a)
    
    if part == 2:
        return b + (c-b)*rv2
    
    if part == 3:
        return d - np.sqrt(rv2)*(d - c)
    
    return -999999.0 
        
rng = np.random.default_rng(135797531)

abcd = (-2., 0., 1., 2.)

N = 1000000

res = np.empty(N)

for k in range(0, N):
    rv1 = rng.random()
    rv2 = rng.random()
    res[k] = sample_trap(abcd, rv1, rv2)

fig, axs = plt.subplots(1, 2, tight_layout=True)

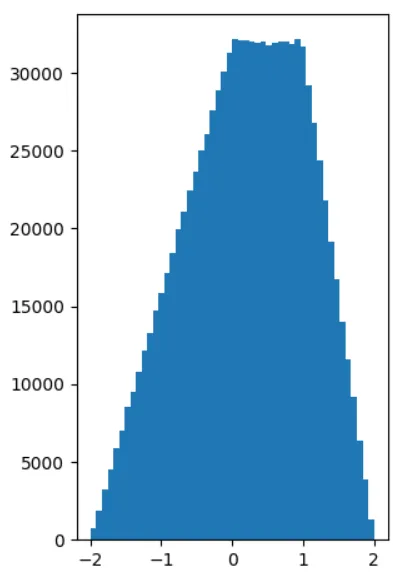
axs[0].hist(res, bins=50)

你应该得到类似的东西

enter image description here


网页内容由stack overflow 提供, 点击上面的
可以查看英文原文,
原文链接