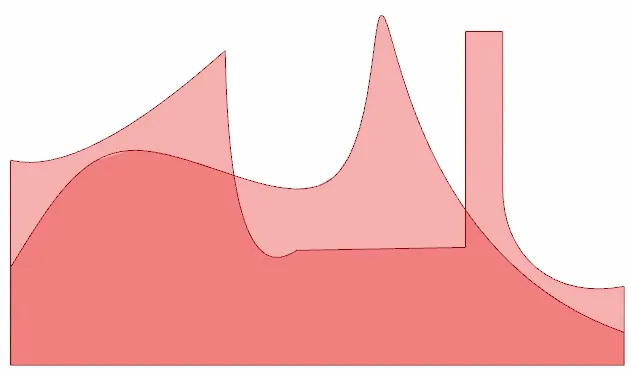
我希望能够使用绘制曲线的概率密度函数生成随机数。下面这两个函数在曲线下有相同的面积,但应该生成具有不同特征的随机数列表。
我试着真正去做它:
np.random.choice 来选择一个范围,在该矩形范围内进行普通的随机操作。
我试着真正去做它:
import matplotlib.pyplot as plt
import numpy as np

areas = [4.397498, 4.417111, 4.538467, 4.735034, 4.990129, 5.292455, 5.633938,
         6.008574, 6.41175, 5.888393, 2.861898, 2.347887, 2.459234, 2.494357,
         2.502986, 2.511614, 2.520243, 2.528872, 2.537501, 2.546129, 7.223747,
         7.223747, 2.448148, 1.978746, 1.750221, 1.659351, 1.669999]
divisons = [0.0, 0.037037, 0.074074, 0.111111, 0.148148, 0.185185, 0.222222,
            0.259259, 0.296296, 0.333333, 0.37037, 0.407407, 0.444444, 0.481481,
            0.518519, 0.555556, 0.592593, 0.62963, 0.666667, 0.703704, 0.740741,
            0.777778, 0.814815, 0.851852, 0.888889, 0.925926, 0.962963, 1.0]
weights = [a/sum(areas) for a in areas]
indexes = np.random.choice(range(len(areas)), 50000, p=weights)
samples = []
for i in indexes:
    samples.append(np.random.uniform(divisons[i], divisons[i+1]))

binwidth = 0.02
binSize = np.arange(min(samples), max(samples) + binwidth, binwidth)
plt.hist(samples, bins=binSize)
plt.xlim(xmax=1)
plt.show()
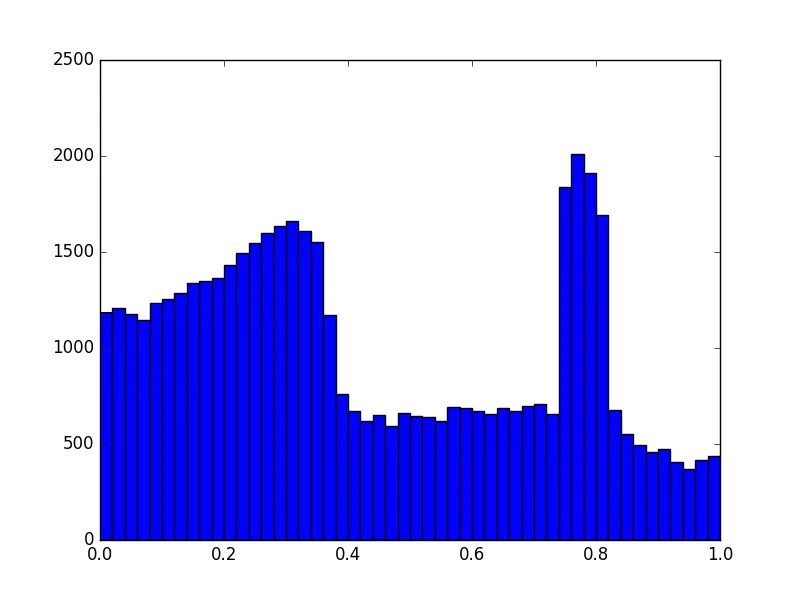
这种方法似乎可行,但有些繁重!