我正在尝试使用ggplotly将ggplot转换,同时在每个点旁边和悬停文本框中具有不同的标签字段。当我尝试在ggplot中显式设置此内容时,标签也会出现不需要的工具提示。
例如,如果我的ggplot是按以下方式编码的:
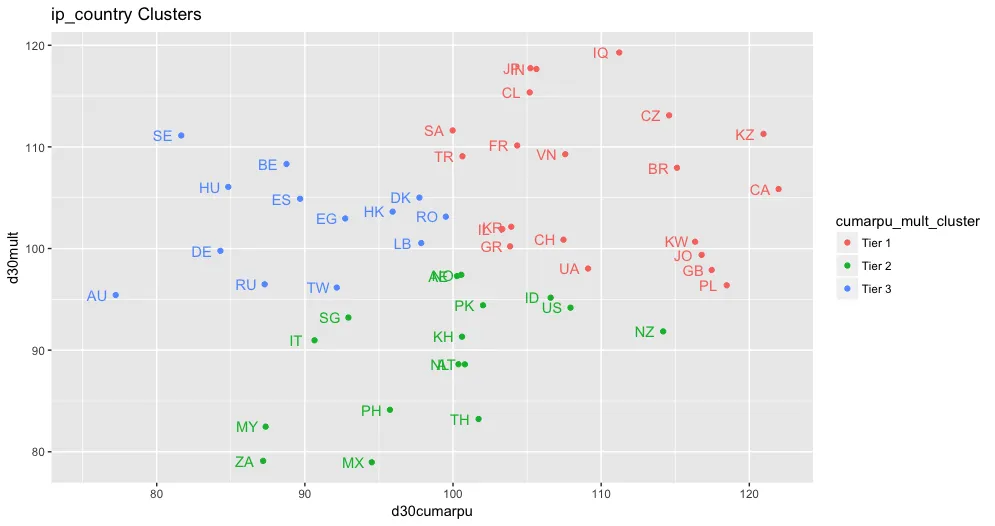
然后它将按预期生成此图像。
例如,如果我的ggplot是按以下方式编码的:
p1 <- ggplot(randomData,
    aes(d30cumarpu, d30mult, col=cumarpu_mult_cluster, label=ip_country,
    text=paste('Country:', ip_country, '<br>',
               'd30cumarpu:', format(d30cumarpu, digits=2), '<br>',
               'd30mult:', format(d30mult, digits=2)))) +
    xlim(range(randomData[,'d30cumarpu'])[1]-2, range(randomData[,'d30cumarpu'])[2]) +
    geom_point() +
    geom_text(aes(x=d30cumarpu - 1.25), show.legend = FALSE) +
    labs(title = paste('ip_country',  'Clusters', sep = ' '))
然后它将按预期生成此图像。
然而,当我将其转换为plotly时
plotly1 <- ggplotly(p1, tooltip=c('text'))
除了使用“悬停比较数据”时显示的点外,我得到了相同的图形,现在标签还有一个悬停工具提示。
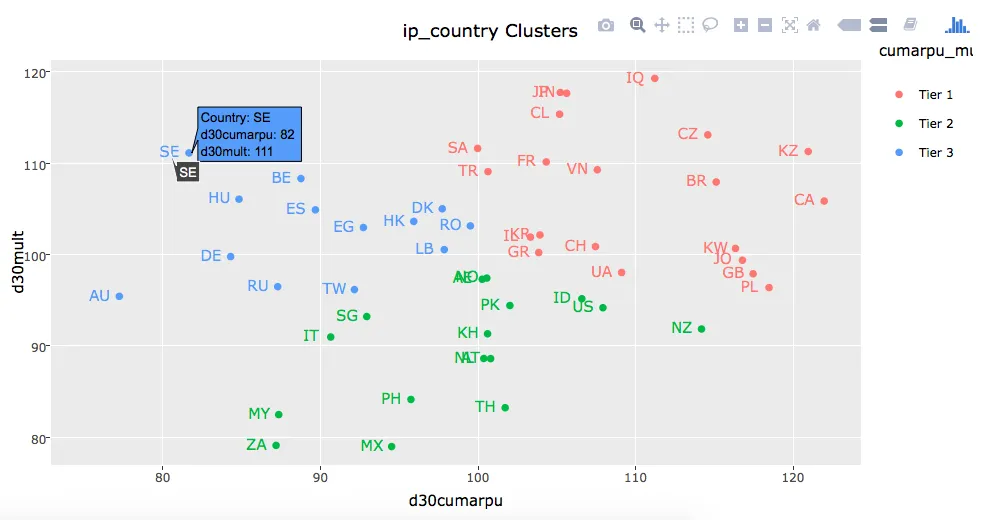
有没有办法去掉标签的悬停提示?
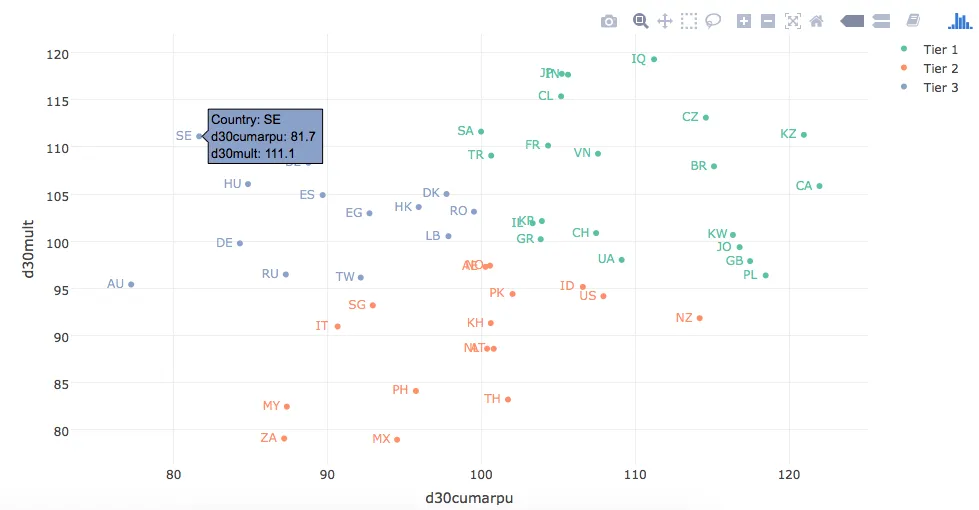
我已经能够使用plot_ly构建相同的内容,并为我的添加文本设置hoverinfo ='none',但我不知道如何将其应用于将ggplot转换为plotly。
plotly1 <- plot_ly(finaldata, x = ~d30cumarpu, y = ~d30mult, color=~cumarpu_mult_cluster,
    text=~paste('Country:', ip_country, '<br>',
                'd30cumarpu:', format(d30cumarpu, digits=3), '<br>',
                'd30mult:', format(d30mult, digits=3)),
    hoverinfo='text') %>%
    add_markers() %>%
    add_text(x = ~d30cumarpu-1,
             y = ~d30mult,
             text = ~ip_country,
             color=~cumarpu_mult_cluster,
             hoverinfo='none',
             showlegend=FALSE)
如果有人想玩一下,这里提供了随机生成和聚类数据的样例:
> dput(randomData)
structure(list(ip_country = structure(c(215L, 107L, 73L, 179L,
37L, 71L, 55L, 103L, 209L, 181L, 13L, 223L, 148L, 203L, 99L,
31L, 95L, 100L, 211L, 166L, 113L, 156L, 64L, 149L, 57L, 42L,
97L, 20L, 186L, 63L, 185L, 90L, 3L, 213L, 114L, 110L, 168L, 12L,
160L, 54L, 157L, 94L, 177L, 118L, 116L, 167L, 45L, 106L, 85L,
230L), .Label = c("??", "AD", "AE", "AF", "AG", "AI", "AL", "AM",
"AO", "AR", "AS", "AT", "AU", "AW", "AX", "AZ", "BA", "BB", "BD",
"BE", "BF", "BG", "BH", "BI", "BJ", "BL", "BM", "BN", "BO", "BQ",
"BR", "BS", "BT", "BW", "BY", "BZ", "CA", "CC", "CD", "CF", "CG",
"CH", "CI", "CK", "CL", "CM", "CN", "CO", "CR", "CV", "CW", "CX",
"CY", "CZ", "DE", "DJ", "DK", "DM", "DO", "DZ", "EC", "EE", "EG",
"ES", "ET", "FI", "FJ", "FK", "FM", "FO", "FR", "GA", "GB", "GD",
"GE", "GF", "GG", "GH", "GI", "GL", "GM", "GN", "GP", "GQ", "GR",
"GT", "GU", "GW", "GY", "HK", "HN", "HR", "HT", "HU", "ID", "IE",
"IL", "IM", "IN", "IQ", "IR", "IS", "IT", "JE", "JM", "JO", "JP",
"KE", "KG", "KH", "KM", "KN", "KR", "KW", "KY", "KZ", "LA", "LB",
"LC", "LI", "LK", "LR", "LS", "LT", "LU", "LV", "LY", "MA", "MC",
"MD", "ME", "MF", "MG", "MH", "MK", "ML", "MM", "MN", "MO", "MP",
"MQ", "MR", "MS", "MT", "MU", "MV", "MW", "MX", "MY", "MZ", "NA",
"NC", "NE", "NG", "NI", "NL", "NO", "NP", "NR", "NZ", "OM", "PA",
"PE", "PF", "PG", "PH", "PK", "PL", "PM", "PR", "PS", "PT", "PW",
"PY", "QA", "RE", "RO", "RS", "RU", "RW", "SA", "SB", "SC", "SD",
"SE", "SG", "SI", "SK", "SL", "SM", "SN", "SO", "SR", "SS", "ST",
"SV", "SX", "SY", "SZ", "TC", "TD", "TG", "TH", "TJ", "TL", "TM",
"TN", "TO", "TR", "TT", "TW", "TZ", "UA", "UG", "US", "UY", "UZ",
"VA", "VC", "VE", "VG", "VI", "VN", "VU", "WF", "WS", "XK", "YE",
"YT", "ZA", "ZM", "ZW"), class = "factor"), cumarpu_mult_cluster = c("Tier 2",
"Tier 1", "Tier 1", "Tier 3", "Tier 1", "Tier 1", "Tier 3", "Tier 2",
"Tier 1", "Tier 1", "Tier 3", "Tier 1", "Tier 2", "Tier 2", "Tier 1",
"Tier 1", "Tier 2", "Tier 1", "Tier 3", "Tier 2", "Tier 1", "Tier 2",
"Tier 3", "Tier 2", "Tier 3", "Tier 1", "Tier 1", "Tier 3", "Tier 2",
"Tier 3", "Tier 3", "Tier 3", "Tier 2", "Tier 1", "Tier 1", "Tier 2",
"Tier 1", "Tier 2", "Tier 2", "Tier 1", "Tier 2", "Tier 3", "Tier 3",
"Tier 3", "Tier 1", "Tier 2", "Tier 1", "Tier 1", "Tier 1", "Tier 2"
), d30cumarpu = c(107.930131712991, 105.222512638255, 117.462222411898,
87.2866387698602, 121.973895325548, 104.33130777092, 84.2980036951461,
90.6509433292393, 100.634933452598, 99.9760666381899, 77.2321875975337,
107.574122251255, 94.5159444597197, 101.725494778504, 105.628530677554,
115.118179594377, 106.590251691644, 111.220280746746, 92.1535863085354,
95.7430771118969, 103.929975913722, 100.367571298246, 89.6791633877171,
87.3513852861858, 97.7303471477638, 107.45589304708, 103.328191803325,
88.7595954264223, 92.9386921777103, 92.7245613539153, 81.6568561472558,
95.9231205973952, 100.268611947988, 109.116286375609, 116.343464755087,
100.606856143597, 118.475725278658, 100.801249546513, 114.185558829789,
114.586159354469, 100.558773396012, 84.8275942303004, 99.5142078508797,
97.8564336084652, 120.958181976138, 102.023229068152, 105.177237108215,
116.781432058498, 103.852448050474, 87.1811277597501), d30mult = c(94.1784926403024,
117.741186943482, 97.8932802054684, 96.4789309381206, 105.851723262244,
110.136846977567, 99.7743057140667, 90.9684514320939, 109.077729534112,
111.61942897035, 95.420466027981, 109.279566678046, 78.9706486359243,
83.2283288606423, 117.656557686126, 107.944474212631, 95.1613044154245,
119.283591488307, 96.1588380493214, 84.1332253212426, 102.143017063566,
88.6171827803067, 104.894135074642, 82.4736323889036, 105.010170995538,
100.867562053473, 101.910735336673, 108.318390254185, 93.2096763159969,
102.95862295423, 111.121658595741, 103.625898970539, 97.2908492702806,
98.0305434605323, 100.669545180646, 91.3219833174809, 96.3799435914652,
88.6044983529687, 91.8462867022671, 113.102456329798, 97.4163905941743,
106.062648944944, 103.134482165704, 100.536030819785, 111.28253787677,
94.4186654082415, 115.359589458142, 99.3755364766521, 100.215752153621,
79.1017256181289)), .Names = c("ip_country", "cumarpu_mult_cluster",
"d30cumarpu", "d30mult"), class = "data.frame", row.names = c(421L,
209L, 142L, 351L, 73L, 138L, 107L, 201L, 409L, 355L, 26L, 436L,
290L, 397L, 193L, 61L, 185L, 195L, 413L, 325L, 221L, 306L, 125L,
292L, 111L, 81L, 189L, 40L, 364L, 123L, 362L, 175L, 6L, 417L,
223L, 215L, 329L, 24L, 313L, 105L, 308L, 183L, 347L, 231L, 227L,
327L, 87L, 207L, 166L, 449L))