我知道这个问题已经被问了很多次,但我认为自那些问题被提出以来,plotly的一些基本语法已经发生了变化。使用
我也尝试添加了以下内容,但没有任何效果:
任何帮助都非常感激!
更新:我通过从Github安装而不是CRAN来更新了plotly。使用这个更新的版本(4.0.0),我已经完成了一部分。
现在发生的事情让我感到困惑。这会添加一个与之前不同的附加工具提示。这个新的工具提示正是我想要的,但它们两个都出现了 - 不是同时出现,而是当我移动鼠标时。请参见下面的两个截图:
更新#2:我发现旧的工具提示(显示长和宽)仅在悬停在边框上时才出现,因此我删除了
ggplotly()创建区域填充地图会给出默认的工具提示,包括经度、纬度、组和我的美学之一的变量。我知道工具提示只显示美学中的内容。我想要做的就是自定义工具提示,使其显示数据集中的一些变量(包括那些未映射到美学的变量),而不显示其他变量(如坐标)。下面是一个可复制的示例以及我迄今为止尝试过的内容。我按照其他问题的回答所给的建议去尝试,但没有成功。#Load dependencies
library(rgeos)
library(stringr)
library(rgdal)
library(maptools)
library(ggplot2)
library(plotly)
#Function to read shapefile from website
dlshape=function(shploc, shpfile) {
temp=tempfile()
download.file(shploc, temp)
unzip(temp)
shp.data <- sapply(".", function(f) {
fp <- file.path(temp, f)
return(readOGR(".",shpfile))
})
}
austria <- dlshape(shploc="http://biogeo.ucdavis.edu/data/gadm2.8/shp/AUT_adm_shp.zip",
"AUT_adm1")[[1]]
#Create random data to add as variables
austria@data$example1<-sample(seq(from = 1, to = 100, by = 1), size = 11, replace = TRUE)
austria@data$example2<-sample(seq(from = 1, to = 100, by = 1), size = 11, replace = TRUE)
austria@data$example3<-sample(seq(from = 1, to = 100, by = 1), size = 11, replace = TRUE)
#Fortify shapefile to use w/ ggplot
austria.ft <- fortify(austria, region="ID_1")
data<-merge(austria.ft, austria, region="id", by.x = "id", by.y = "ID_1")
#Save as ggplot object
gg<-ggplot(data, aes(x = long, y = lat, fill = example1, group = group)) +
geom_polygon() + geom_path(color="black",linetype=1) +
coord_equal() +
scale_fill_gradient(low = "lightgrey", high = "darkred", name='Index') +xlab("")+ylab("") +
theme(axis.text = element_blank(),
axis.title = element_blank(),
axis.ticks = element_blank()) +
theme(panel.grid.major = element_blank(), panel.grid.minor = element_blank(),
panel.background = element_blank(), axis.line = element_line(colour = "black")) +
theme(panel.grid.major = element_blank(), panel.grid.minor = element_blank(),
panel.background = element_blank(), axis.line = element_line(colour = "black"))
#Plot using ggplotly
ggplotly(gg)
从这里开始,我尝试了两种不同的方法。其中最成功的一种方法在某种程度上帮助我实现了目标。我可以向工具提示添加新变量,但我无法做到以下两点:1)我无法摆脱默认显示的其他变量(来自美学),2)我无法将变量重命名为数据集中的列名称之外的其他名称(例如,我想将“example3”标记为“Example III”)。以下是该方法:
#Save as a new ggplot object except this time add ``label = example3`` to the aesthetics
 gg2<-ggplot(data, aes(x = long, y = lat, fill = example1, group = group, label = example3)) +
  geom_polygon() + geom_path(color="black",linetype=1) +
  coord_equal() +
  scale_fill_gradient(low = "lightgrey", high = "darkred", name='Index') +xlab("")+ylab("") +
  theme(axis.text = element_blank(),
        axis.title = element_blank(),
        axis.ticks = element_blank()) +
  theme(panel.grid.major = element_blank(), panel.grid.minor = element_blank(),
        panel.background = element_blank(), axis.line = element_line(colour = "black")) +
  theme(panel.grid.major = element_blank(), panel.grid.minor = element_blank(),
        panel.background = element_blank(), axis.line = element_line(colour = "black"))

#Save as plotly object then plot
gg2 <- plotly_build(gg2)
gg2
我也尝试添加了以下内容,但没有任何效果:
gg2$data[[1]]$text <- paste("Example I:", data$example1, "<br>",
                           "Example II:", data$example2, "<br>",
                           "Example III:", data$example3)
任何帮助都非常感激!
更新:我通过从Github安装而不是CRAN来更新了plotly。使用这个更新的版本(4.0.0),我已经完成了一部分。
gg2$x$data[[2]]$text <- paste("Example I:", data$example1, "<br>",
                             "Example II:", data$example2, "<br>",
                             "Example III:", data$example3)
gg2
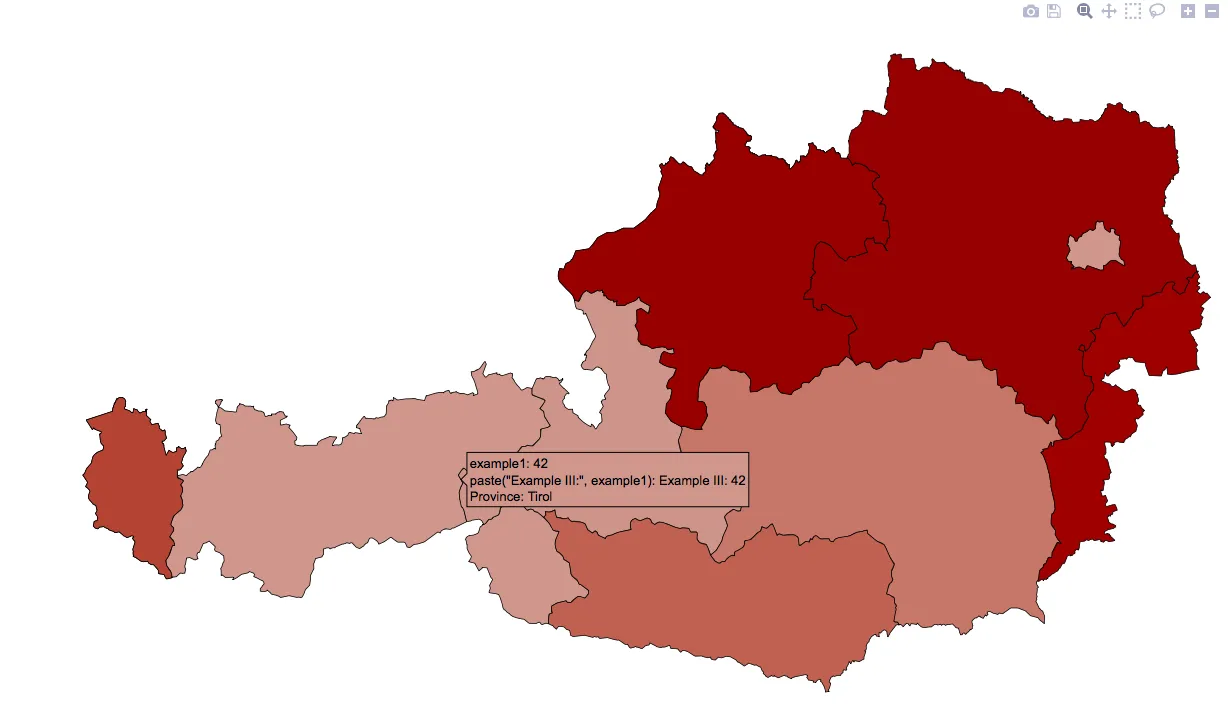
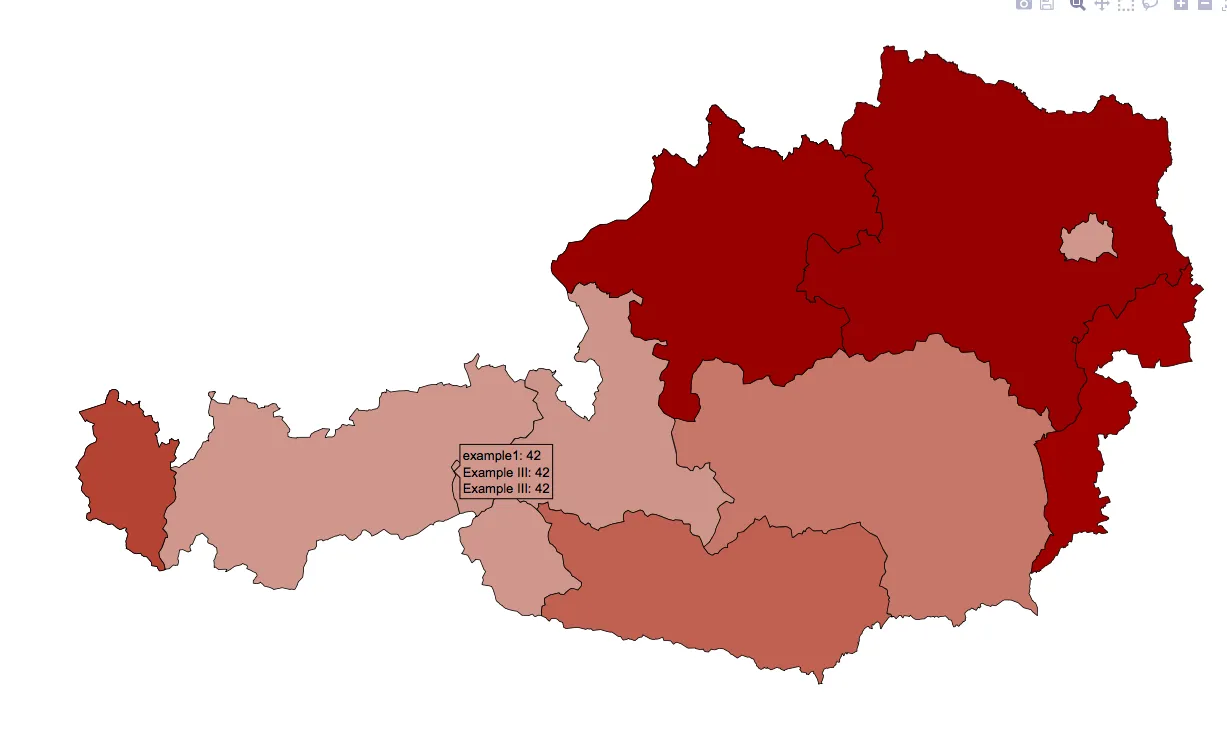
现在发生的事情让我感到困惑。这会添加一个与之前不同的附加工具提示。这个新的工具提示正是我想要的,但它们两个都出现了 - 不是同时出现,而是当我移动鼠标时。请参见下面的两个截图:
更新#2:我发现旧的工具提示(显示长和宽)仅在悬停在边框上时才出现,因此我删除了
geom_path(color =“black”,linetype = 1)命令(以删除边框),现在我已成功解决了这个问题。但是,我仍然无法修改工具提示中显示的标签。
更新#3:我发现如何编辑标签,但仅适用于一个变量。这太疯狂了!以下是我的工作流程:
#Load dependencies
library(rgeos)
library(stringr)
library(rgdal)
library(maptools)
library(ggplot2)
library(plotly)
#Function to read shapefile from website
dlshape=function(shploc, shpfile) {
temp=tempfile()
download.file(shploc, temp)
unzip(temp)
shp.data <- sapply(".", function(f) {
fp <- file.path(temp, f)
return(readOGR(".",shpfile))
})
}
austria <- dlshape(shploc="http://biogeo.ucdavis.edu/data/gadm2.8/shp/AUT_adm_shp.zip",
"AUT_adm1")[[1]]
#Create random data to add as variables
austria@data$example1<-sample(seq(from = 1, to = 100, by = 1), size = 11, replace = TRUE)
austria@data$example2<-sample(seq(from = 1, to = 100, by = 1), size = 11, replace = TRUE)
austria@data$example3<-sample(seq(from = 1, to = 100, by = 1), size = 11, replace = TRUE)
#Fortify shapefile to use w/ ggplot
austria.ft <- fortify(austria, region="ID_1")
data<-merge(austria.ft, austria, region="id", by.x = "id", by.y = "ID_1")
#Save as ggplot object
gg<-ggplot(data, aes(x = long, y = lat, fill = example1, group = group, text = paste("Province:", NAME_1))) +
geom_polygon(color="black", size=0.2) +
coord_equal() +
scale_fill_gradient(low = "lightgrey", high = "darkred", name='Index') +xlab("")+ylab("") +
theme(axis.text = element_blank(),
axis.title = element_blank(),
axis.ticks = element_blank()) +
theme(panel.grid.major = element_blank(), panel.grid.minor = element_blank(),
panel.background = element_blank(), axis.line = element_line(colour = "black")) +
theme(panel.grid.major = element_blank(), panel.grid.minor = element_blank(),
panel.background = element_blank(), axis.line = element_line(colour = "black"))
gg <- plotly_build(gg)
gg
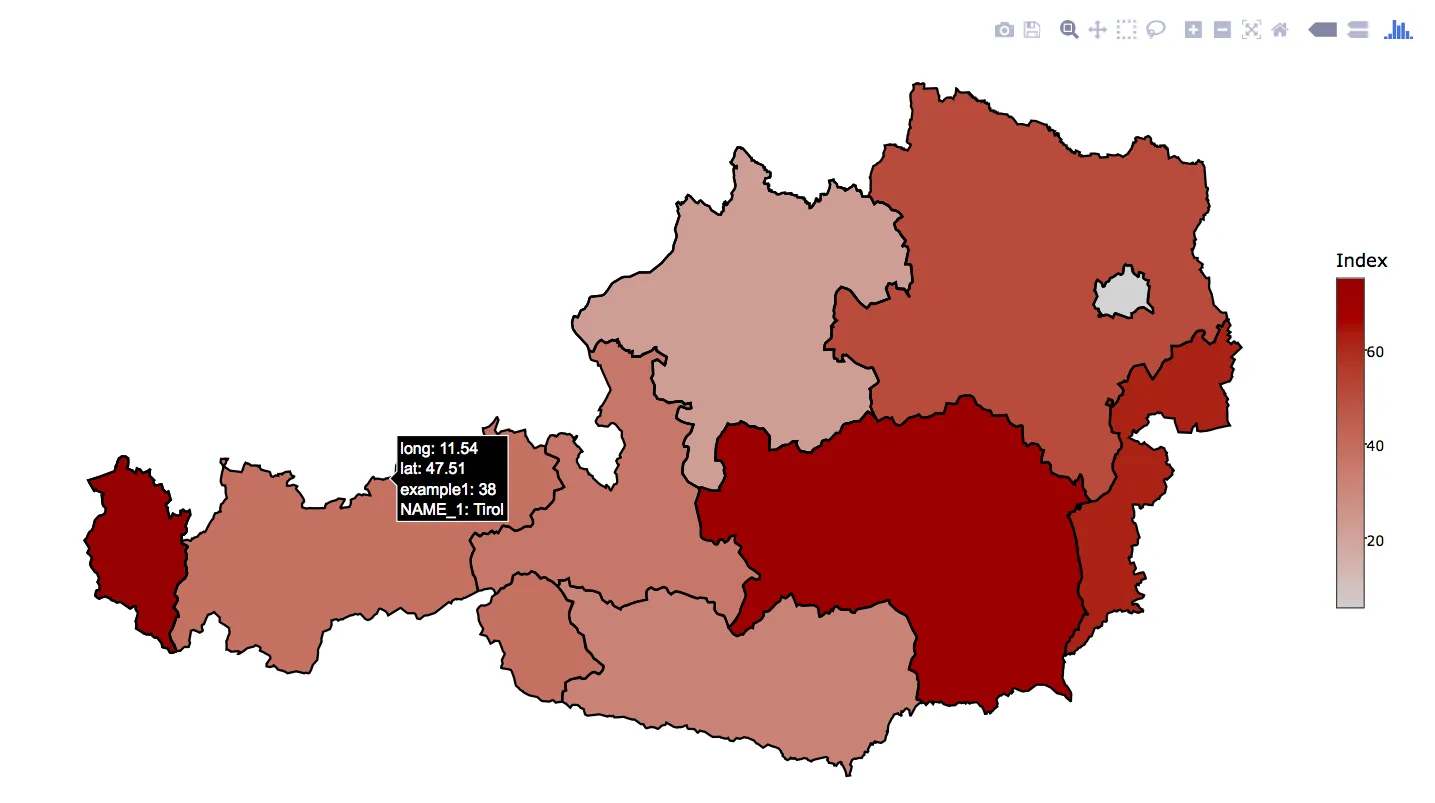
这将产生以下绘图:
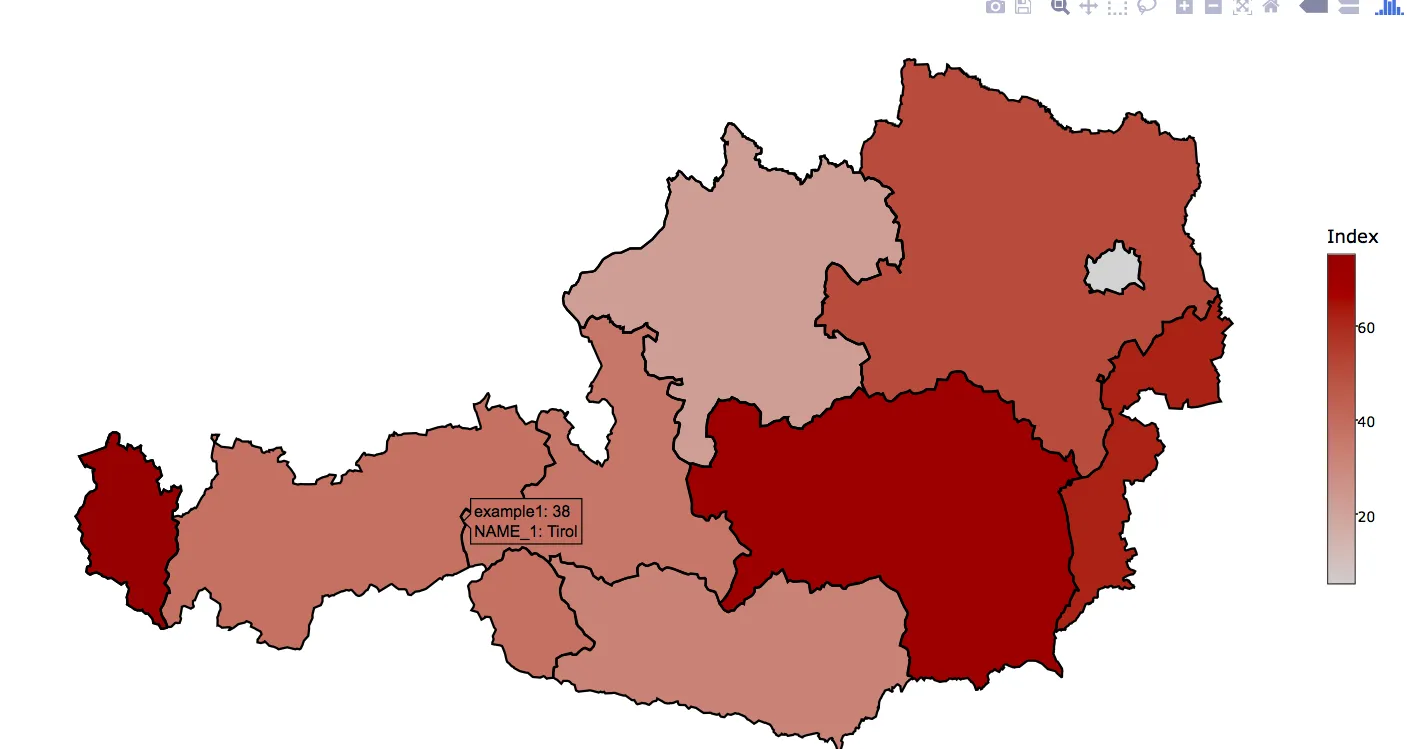
请注意,“Province”现在是大写的(之前不是)。诀窍是将text = paste("Province:", NAME_1)添加到美学中。然而,当我尝试使用text2=paste("Example III:", example1)添加其他标签更改时,会出现以下情况:
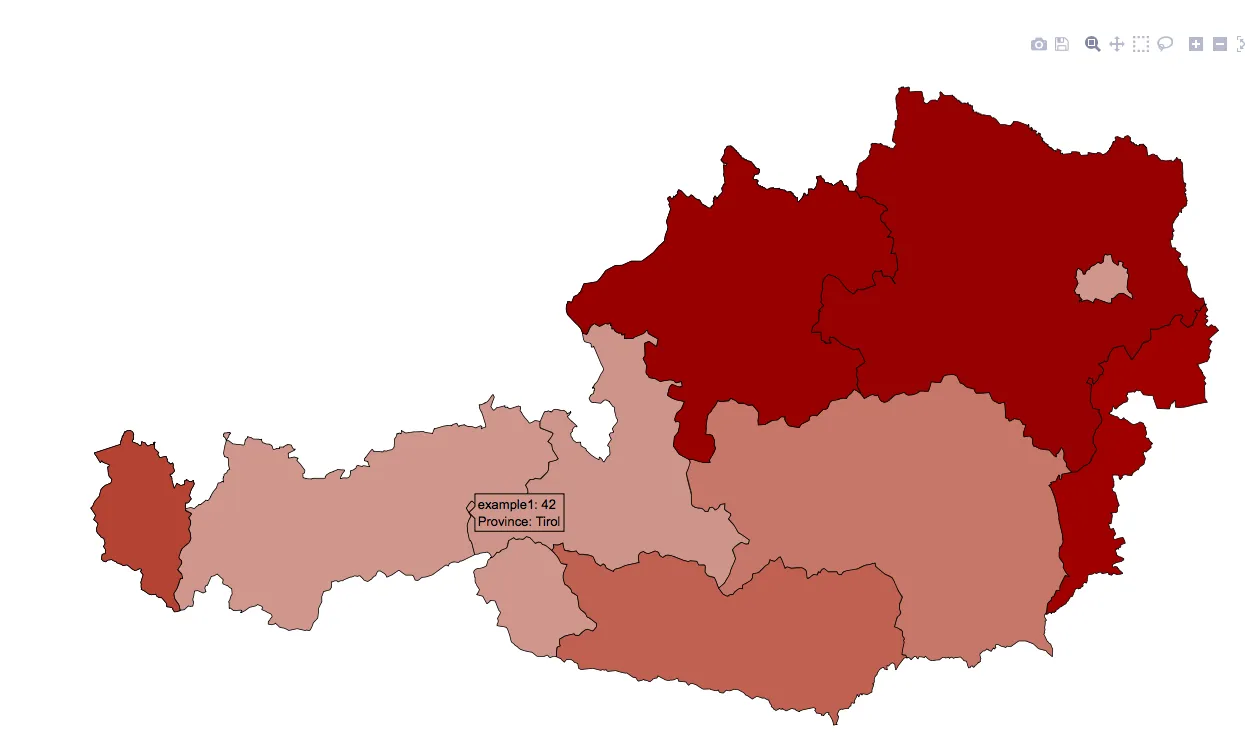
请注意,它无法像呈现text1一样呈现text2。因此,我尝试添加一个没有text2的副本,如下所示:text=paste("Example III:", example1) - 它会产生以下奇怪的结果:
我开始认为在plotly的ggplot转换中切换“legend”选项这么简单的事情是不可能的。
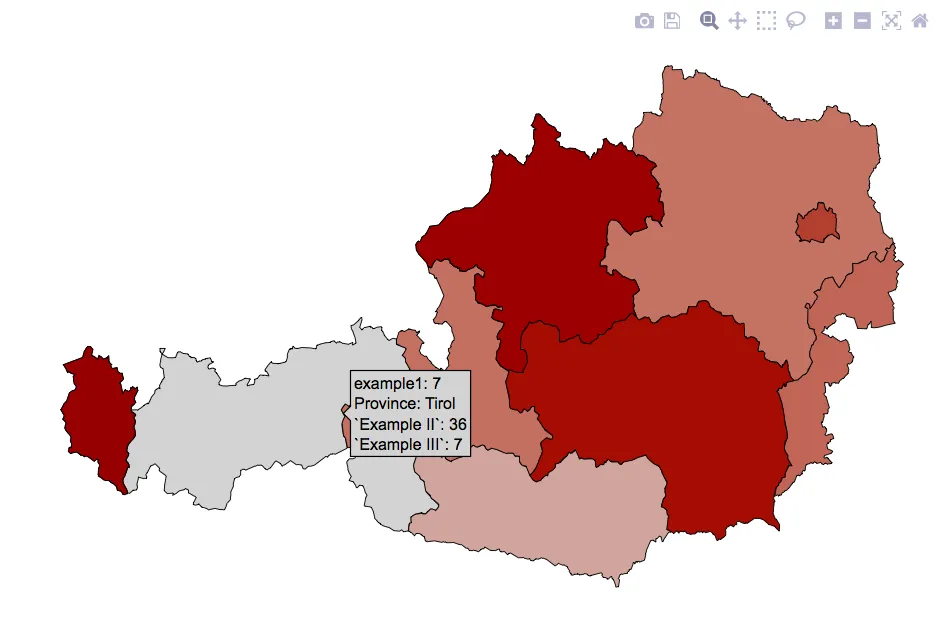
更新#4:所以我决定用另一种方式来解决这个问题。相反,我决定改变变量名本身。我本来会从一开始就这样做的,只是我不确定ggplot2是否接受带有空格的变量 - 我找到了`variable`可以工作的方法。所以我继续重命名变量。它有效 - 但是有一个问题,文本周围出现了引号。现在我需要一种方法来摆脱这些!!!任何人有想法吗?谢谢!这是我所说的引用文字的图像: