ggplot2:在x轴上创建一个空白区域

3
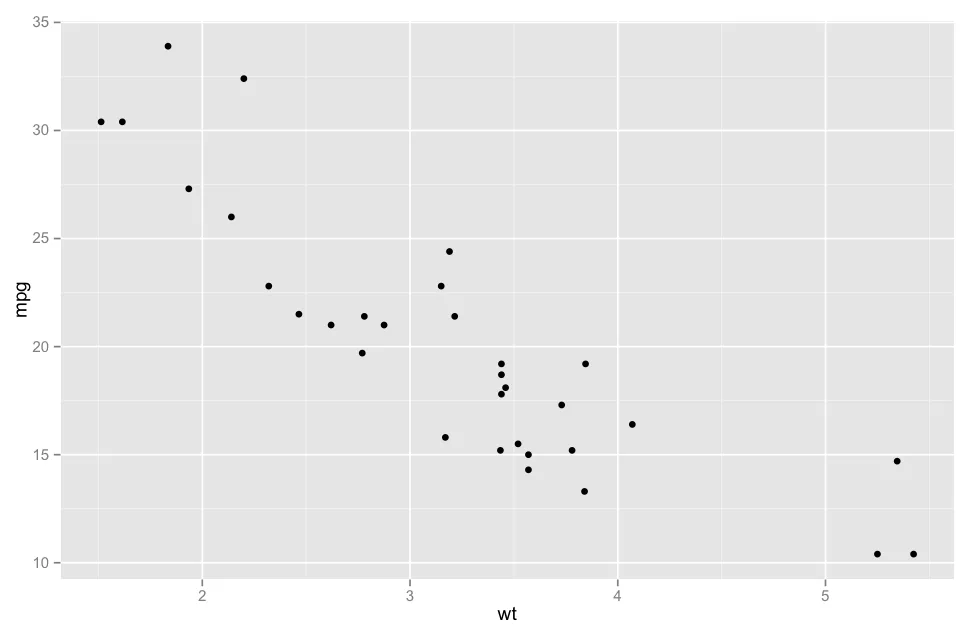
在下面的图中,我想在x轴上的位置3创建一个空白区域。换句话说,当wt>=3时,我希望点和坐标轴标度向右移动一些任意选择的值。这样是否有意义?
ggplot(mtcars, aes(x = wt, y = mpg)) + geom_point()

图片描述在此

我可以简单地修改我的数据,并将0.5添加到mpg的每个值中,其中wt>=3,但这并不能解决x轴的问题。

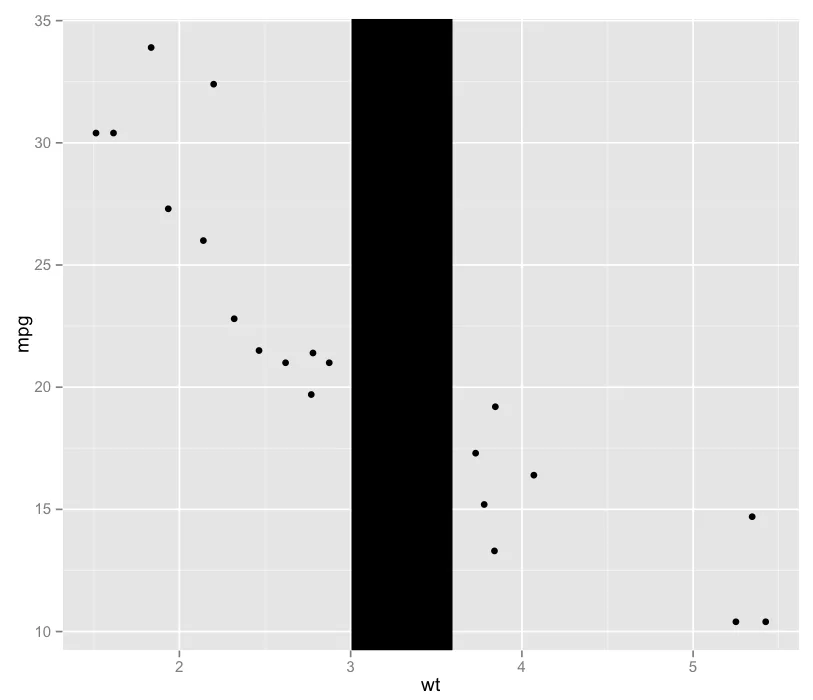
我可能会重述我的问题,即在下面的图表中,我希望垂直线不重叠数据,因此所有数据(以及x轴)都应向左移动垂直线的厚度。

ggplot(mtcars, aes(x = wt, y = mpg)) + geom_point() + geom_vline(xintercept=3, size=30)

enter image description here

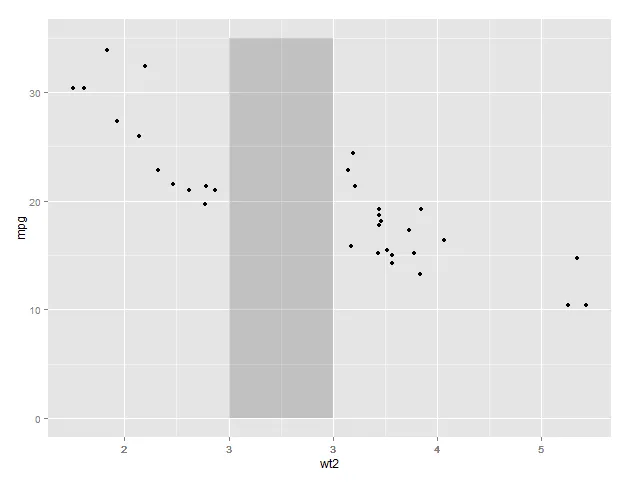
我在考虑使用facet_wrap或者viewport。也许可以将每个mpg的值都加上一个常数,其中wt>=3,然后手动设置x轴的值。


请参考这个关于如何在坐标轴中插入断点的相关问题:链接 - Jota
我最接近的方法是使用plotrix包:
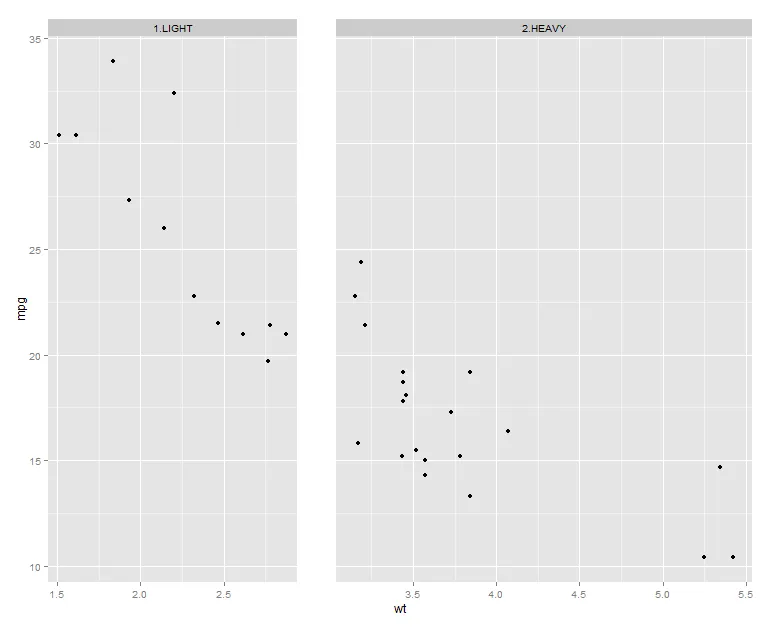
gap.plot(mtcars$wt,mtcars$mpg,gap=c(2.99999,3.000001),gap.axis="x")。但我没有尝试更改间隙大小。 - Jota
或者,您可以尝试使用ggplot2的方法,如下所示: mtcars$foo<-ifelse(mtcars$wt >=3 ,c("over 3"),c("under 3")) mtcars$foo<-factor(mtcars$foo, levels=c("under 3","over 3")) ggplot(mtcars, aes(x = wt, y = mpg)) + geom_point() + facet_wrap(~foo,scales="free_x")。虽然还需要一些工作。 - Jota
1
有很多好的答案。非常感谢!我选择接受Henrik的答案,因为他找到了最接近所要求的解决方案,但我还没有决定选择哪个解决方案来展示我的数据! - Remi.b
3个回答

2

我不完全确定您在寻找什么,并且看着自己的图表上的奇怪轴线让我感到困惑...您是指这样的吗?

mtcars$wt2 <- with(mtcars, ifelse(wt > 3, wt+1, wt))

ggplot(mtcars, aes(x = wt2, y = mpg)) +
  geom_point() +
  annotate("rect", xmin = 3, xmax = 4, ymin = 0, ymax = 35, alpha = 0.2) +
  scale_x_continuous(breaks = round(mtcars$wt2), label = round(mtcars$wt))

enter image description here


1
类似于@ Frank,已测试...
x <- mtcars
x$group <- ""
x[x$wt<3,]$group  <- "1.LIGHT"
x[x$wt>=3,]$group <- "2.HEAVY"

library(ggplot2)
library(grid)    #for unit(...)
ggplot(x, aes(x=wt,y=mpg)) + 
  geom_point() + 
  facet_grid(~group,scales="free",space="free") + 
  theme(panel.margin = unit(2, "lines"))

产生以下效果:

enter image description here


1
这个怎么样?
mtcars <- transform(mtcars, split = ifelse(wt >= 3, "b", "a" ))

ggplot(mtcars, aes(x = wt, y = mpg)) + 
       geom_point() + 
       facet_wrap(~split, scales = "free_x")

网页内容由stack overflow 提供, 点击上面的
可以查看英文原文,
原文链接