在我的r markdown报告中,我使用了两个代码块。
第一个:
第一个:
```{r, include = FALSE, echo=FALSE, results='asis'}```
这是我加载所有包并进行计算的地方。
其次
{r, fig.margin = TRUE, fig.width=10,
fig.height=4.5, echo=FALSE, results='asis',
message=FALSE, warning = FALSE}
我有一个for循环,在其中过滤第一块中的数据,并为每个i制作ggplots。
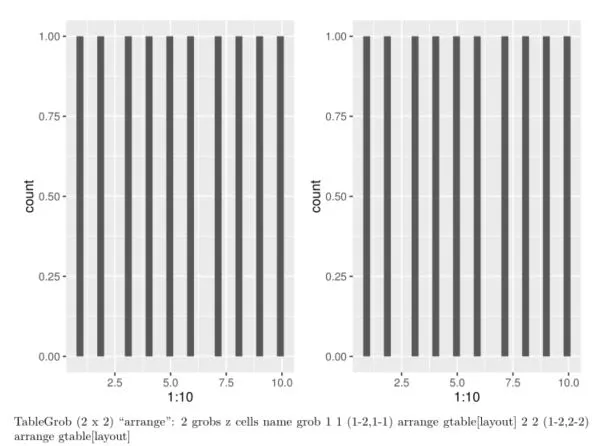
我的问题是,当我在第二块中产生2个图时,我通过grid.arrange将它们组合成一个网格,但有一个额外的注释我不想显示。
TableGrob (2 x 2) "arrange": 2 grobs
  z     cells    name           grob
1 1 (1-2,1-1) arrange gtable[layout]
2 2 (1-2,2-2) arrange gtable[layout]
title: "Test"
author: "Maybe It's You"
date: "2016.09.01"
output: pdf_document
---

```{r setup, include=FALSE}
knitr::opts_chunk$set(echo = TRUE)
library(grid)
library(gridExtra)
library(ggplot2)

lay <- rbind(c(1,2),
             c(1,2))
gs <- list()

```


```{r cars}
summary(cars)
```

## Including Plots

You can also embed plots, for example:

```{r pressure, echo=FALSE, results='asis', message=FALSE, warning = FALSE}
p1 <- qplot(1:10)
p2 <- qplot(1:10)
gs[[1]] <- p1
gs[[2]] <- p2


wykres <- grid.arrange(grobs = gs, layout_matrix = lay)
print(wykres)

```
带有gridExtra注释的结果片段(TablGrob...)