我希望生成一个包含交互式shiny应用的R markdown页面。它可以正常工作,但输出区域非常小且需要滚动条。我想要消除滚动条并展示两张完整宽度和高度的图像。怎样可以实现这个目标?
我已经尝试过:
我已经尝试过:
options(width = 800)
目前它看起来是这样的: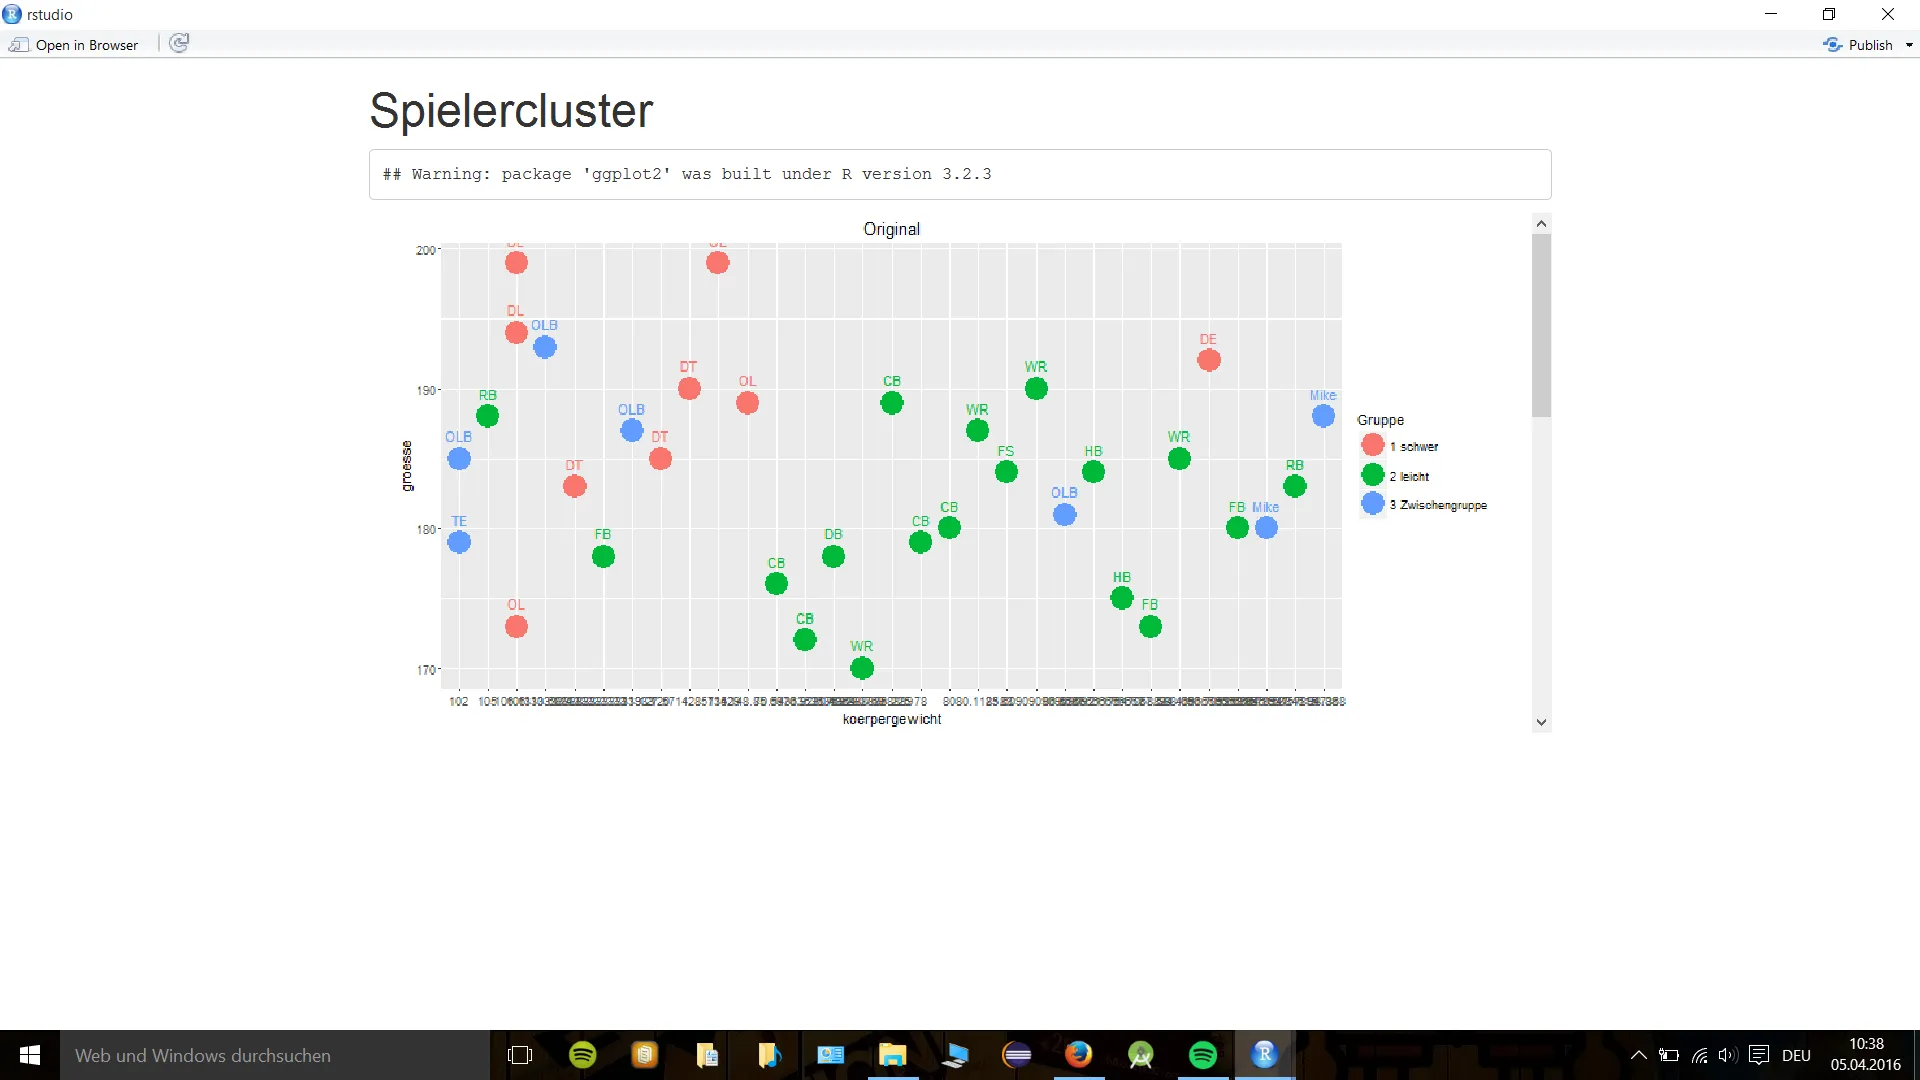
    ---
title: "Spielercluster"
output: html_document
runtime: shiny
---
```{r,echo=FALSE}
library(ggplot2)
library(shiny)

data<-read.csv2('data.csv',header=T,sep=",")
rawData<-read.csv2('rawData.csv',header=T,sep=",")
cluster<-read.csv2('cluster.csv',header=T,sep=",")
colors<-c("green","red","black")

ui<-fluidPage(plotOutput("plot1", hover = "plot_hover"),
              plotOutput("plot2", hover = "plot_hover"),
              verbatimTextOutput("info")
)

server <- function(input, output) {

  output$plot1 <- renderPlot({
ggplot(rawData, aes(koerpergewicht, groesse, color =  factor(data$gruppe))) +
          geom_point() + labs(title = paste(nlevels(factor(colors))))+geom_point(size=8)+geom_text(aes(label=position),vjust=-1.5)+scale_color_manual(name = "Gruppe",
  labels = c("1 schwer", "2 leicht","3 Zwischengruppe"),
  values = c(rgb(0.9725490196078431,0.4627450980392157,0.4274509803921569,1),rgb(0,0.7294117647058824,0.2196078431372549,1),rgb(0.3803921568627451,0.6117647058823529,1,1)))+ggtitle("Original")
  })

  output$plot2 <- renderPlot({
ggplot(rawData, aes(koerpergewicht, groesse, color =  factor(cluster$x))) +
          geom_point() + labs(title = paste(nlevels(factor(colors))))+geom_point(size=8)+geom_text(aes(label=position),vjust=-1.5)+scale_color_manual(name = "Gruppe",
  labels = c("1 schwer", "2 leicht","3 Zwischengruppe"),
  values = c(rgb(0.9725490196078431,0.4627450980392157,0.4274509803921569,1),rgb(0,0.7294117647058824,0.2196078431372549,1),rgb(0.3803921568627451,0.6117647058823529,1,1)))+ggtitle("Berechnet")
  })


  output$info <- renderPrint({
    nearPoints(rawData, input$plot_hover, , threshold = 10, maxpoints = 1,
               addDist = TRUE)
  })
}

shinyApp(ui, server)
```