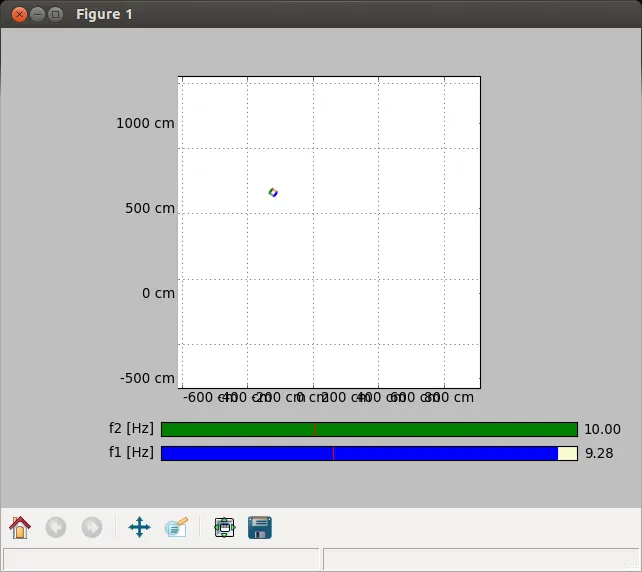
我使用此代码为轴添加单位,但是x轴看起来很糟糕,数字和单位互相重叠了。您有什么解决方法吗?
plt.gca().xaxis.set_major_formatter(FormatStrFormatter('%d cm'))
plt.gca().yaxis.set_major_formatter(FormatStrFormatter('%d cm'))
我使用此代码为轴添加单位,但是x轴看起来很糟糕,数字和单位互相重叠了。您有什么解决方法吗?
plt.gca().xaxis.set_major_formatter(FormatStrFormatter('%d cm'))
plt.gca().yaxis.set_major_formatter(FormatStrFormatter('%d cm'))
你需要旋转刻度的文本,可以尝试以下方法:
import matplotlib.pyplot as plt
import matplotlib.ticker as mticker

plt.plot(range(1000,11000,1000),range(10))

plt.gca().xaxis.set_major_formatter(mticker.FormatStrFormatter('%d cm'))
plt.gca().yaxis.set_major_formatter(mticker.FormatStrFormatter('%d cm'))

for txt in plt.gca().xaxis.get_majorticklabels():
    txt.set_rotation(90)

plt.tight_layout()
plt.show()
在每个刻度上都指定使用的单位是不必要的,因为它将沿着特定轴始终相同。我建议您使用xlabel()和ylabel()方法,就像matplotlib文档中的这个示例一样:
http://matplotlib.org/examples/text_labels_and_annotations/text_demo_fontdict.html