我想创建一个使用两个变量以不同方式填充的ggplot图。基于这个解决方案,我制作了如下代码:
x = c("Band 1", "Band 2", "Band 3")
y1 = c("1","2","3")
y2 = c("2","3","4")

to_plot <- data.frame(x=x,y1=y1,y2=y2)
melted<-melt(to_plot, id="x")

ggplot(melted,aes(x=x,y=value,fill=variable)) +
        geom_bar(stat="identity",position = "identity", alpha=.3)
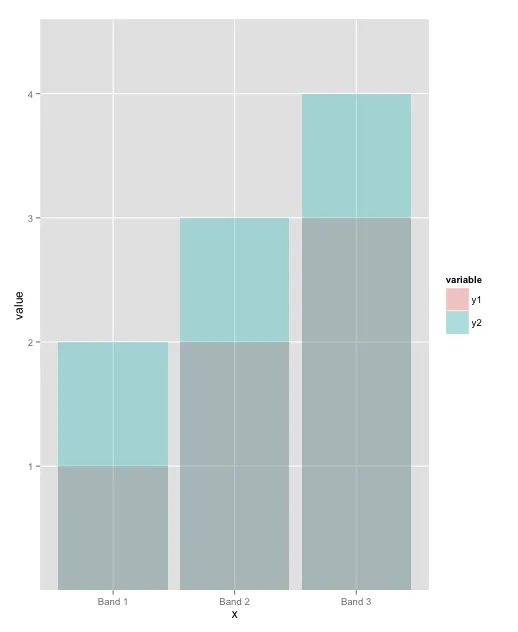
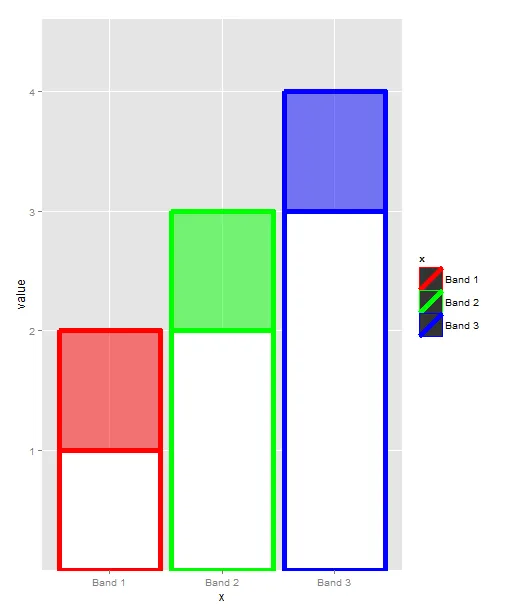
但是我想要用不同的颜色为每个Band值上色,同时将y1变成带有给定Band颜色边框的白色条形图,将y2变成给定Band颜色的条形图。如何实现?
scale_alpha_manual(values = c(1, 0.5))而没有guide = F时,您会在图例中得到黑色矩形和灰色矩形。如何将灰色更改为白色? - Nicolabo