如何使用变量填充ggplot形状文件地图?

3

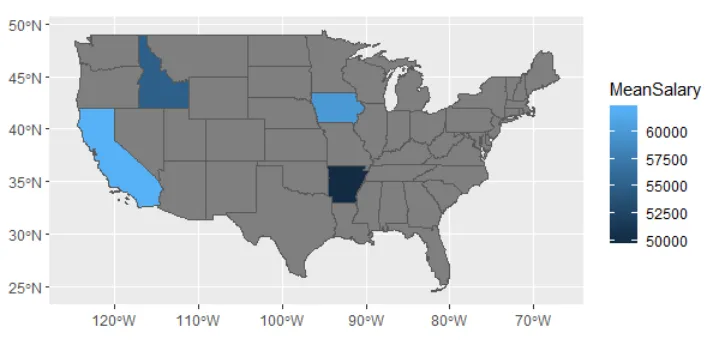
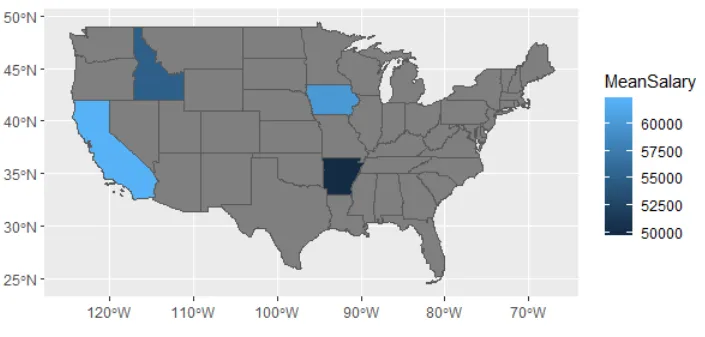
我正在尝试填充一个美国地图,其中每个州都以平均薪资为标准进行填充(使用默认的颜色比例尺)。我有形状文件和一个数据框,它看起来像这样(数据已伪造):

data <- structure(list(State = c("Arkansas",
                           "Iowa",
                           "California",
                           "Idaho"),
                 MeanSalary = c(50000,60000,62000,55000)),
                 row.names=1:4, class = "data.frame")

这是我的代码:

library(tidyverse)
library(rgdal)

map <- readOGR(dsn = ".", layer = "usamap")

PlotData <- merge(map, data, by = "State")

到目前为止,一切都很正常。 我还可以创建一个空地图:

map_base <- ggplot(data = PlotData, mapping=(aes(x=long, y = lat, group = group)) +
geom_polygon(color = "black", fill = NA)
map_base

然而,我无法使用数值填充地图。

map_base <- ggplot(data = PlotData, mapping=(aes(x=long, y = lat, group = group)) +
geom_polygon(color = "black", fill = PlotData$MeanSalary)
map_base

我遇到了这个错误:
Error: Aesthetics must be either length 1 or the same as the data (2834334): fill

我哪里出了问题?

1个回答

2
我提供了两种使用ggplot2绘制多边形的解决方案。
解决方案1:geom_sf sf类是R中下一代空间数据类。 geom_sf可以绘制sf对象。要实现这一点,我们需要将sp对象转换为sf对象。在此示例中,我使用USAboundaries软件包中的州空间多边形作为示例。
library(tidyverse)
library(sf)
library(USAboundaries)

# Get the state data
state <- us_states()

# Check the class
class(state)
# [1] "sf"         "data.frame"

# Create example data frame
data <- structure(list(State = c("Arkansas",
                                 "Iowa",
                                 "California",
                                 "Idaho"),
                       MeanSalary = c(50000,60000,62000,55000)),
                  row.names=1:4, class = "data.frame")

# Merge data to state and filter for these records
state_filter <- state %>% 
  left_join(data, by = c("name" = "State")) %>%
  # Remove Hawaii, Alaska, and Puerto Rico to just focus on the rest states
  filter(!name %in% c("Hawaii", "Alaska", "Puerto Rico"))

# Plot the data
ggplot(state_filter) +
  geom_sf(aes(fill = MeanSalary))

enter image description here

解决方案2: ggspatial包

ggspatial包可以绘制sp对象。因此,如果您不想使用sf对象,可以考虑使用ggspatial

最初的回答

library(tidyverse)
library(sf)
library(USAboundaries)
library(sp)
library(ggspatial)

# Convert the sf object to sp object
state_filter_sp <- as(state_filter, "Spatial")

# Plot the data
ggplot() +
  annotation_spatial(state_filter_sp) +
  layer_spatial(state_filter_sp, aes(fill = MeanSalary))

enter image description here


网页内容由stack overflow 提供, 点击上面的
可以查看英文原文,
原文链接