使用两个变量在ggplot中并排绘制条形图

20

我想在R Studio中使用ggplot创建一个条形图,将两个变量并排放置。我尝试了在网上找到的其他人的建议,但无法使其工作。

这是我使用的数据:

x <- c(5,17,31,9,17,10,30,28,16,29,14,34)

y <- c(1,2,3,4,5,6,7,8,9,10,11,12)

day <- c(1,2,3,4,5,6,7,8,9,10,11,12)

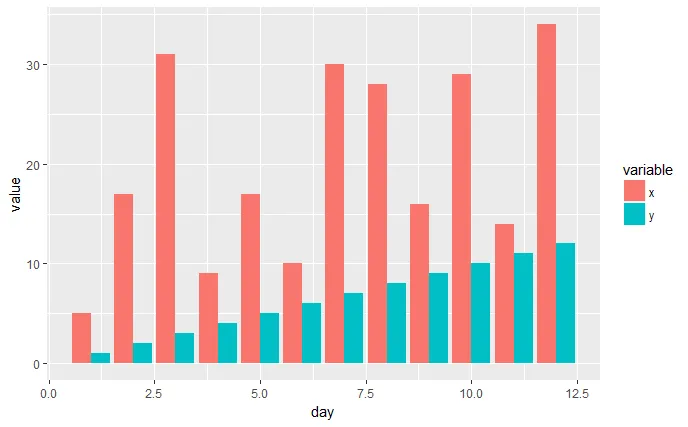
所以,我的目的是在X轴上有日期,而且还要有x和y的并排条形图(x和y需要有颜色),与日期对应。

我做的第一件事是创建一个数据帧:

df1 <- data.frame(x,y,day)

然后我尝试了:

ggplot(df1, aes(x = day, y = x,y)) + geom_bar(stat = "identity",color = x, width = 1, position="dodge")

但我无法让它正常工作。 有什么建议可以帮我实现这个功能吗?


跟进问题:您希望颜色基于日期吗?还是基于他们属于“x”组或“y”组? - TaylorV
2个回答

40

你想得对,我认为reshape2包中的melt()函数是你要寻找的。

library(ggplot2)
library(reshape2)

x <- c(5,17,31,9,17,10,30,28,16,29,14,34)
y <- c(1,2,3,4,5,6,7,8,9,10,11,12)
day <- c(1,2,3,4,5,6,7,8,9,10,11,12)


df1 <- data.frame(x, y, day)
df2 <- melt(df1, id.vars='day')
head(df2)

ggplot(df2, aes(x=day, y=value, fill=variable)) +
    geom_bar(stat='identity', position='dodge')

这里输入图像描述

编辑 我认为来自tidyverse的tidyr软件包中的pivot_longer()函数现在可能是处理这类数据操作的更好方法。 它比melt()提供了更多控制,并且还有一个pivot_wider()函数来执行相反的操作。

library(ggplot2)
library(tidyr)

x <- c(5,17,31,9,17,10,30,28,16,29,14,34)
y <- c(1,2,3,4,5,6,7,8,9,10,11,12)
day <- c(1,2,3,4,5,6,7,8,9,10,11,12)


df1 <- data.frame(x, y, day)
df2 <- tidyr::pivot_longer(df1, cols=c('x', 'y'), names_to='variable', 
values_to="value")
head(df2)

ggplot(df2, aes(x=day, y=value, fill=variable)) +
    geom_bar(stat='identity', position='dodge')

完美,正是我想要的...谢谢你的帮助。 - Electrino

5

或者您可以使用facet_wrap生成两个图表:

  library("ggplot2")
  library("reshape")
  x <- c(5,17,31,9,17,10,30,28,16,29,14,34)
  y <- c(1,2,3,4,5,6,7,8,9,10,11,12)
  day <- c(1,2,3,4,5,6,7,8,9,10,11,12)
  df1 <- data.frame(x,y,day)
  df2 <- reshape::melt(df1, id = c("day"))
  ggplot(data = df2, aes(x = day, y = value, fill = variable)) + geom_bar(stat = "identity")+ facet_wrap(~ variable) + scale_x_continuous(breaks=seq(1,12,2))

enter image description here 如果你想让条形图根据日期显示不同颜色,使用fill = day

ggplot(data = df2, aes(x = day, y = value, fill = day)) + geom_bar(stat = "identity") + facet_wrap(~ variable) + scale_x_continuous(breaks=seq(1,12,2)) 

enter image description here


值得注意的是,如果将“day”转换为因子,那么日期将不会像这样连续。 - TaylorV
你可以使用 + scale_x_continuous(breaks=seq(1,12,2)) 来在x轴上显示整数值。 - Edgar Santos

网页内容由stack overflow 提供, 点击上面的
可以查看英文原文,
原文链接