如何按升序对柱状图中的条形进行排序

16
我使用
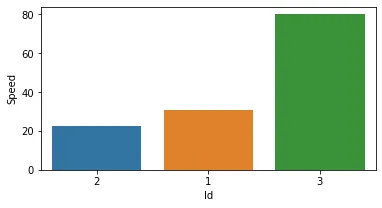
matplotlib.pyplot和seaborn库创建了一个条形图。如何按照Speed的升序对条形进行排序?我想看到速度最低的条形在左边,速度最高的条形在右边。
df =
    Id         Speed
    1          30
    1          35 
    1          31
    2          20
    2          25
    3          80

我的代码:

import pandas as pd
import matplotlib.pyplot as plt
import seaborn as sns

%matplotlib inline

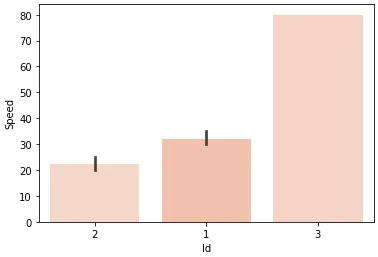
result = df.groupby(["Id"])['Speed'].aggregate(np.median).reset_index()

norm = plt.Normalize(df["Speed"].values.min(), df["Speed"].values.max())
colors = plt.cm.Reds(norm(df["Speed"])) 

plt.figure(figsize=(12,8))
sns.barplot(x="Id", y="Speed", data=result, palette=colors)
plt.ylabel('Speed', fontsize=12)
plt.xlabel('Id', fontsize=12)
plt.xticks(rotation='vertical')
plt.show()
2个回答

17
df.groupby(['Id']).median().sort_values("Speed").plot.bar()

在聚合后,使用.sort_values("Speed").sort_values('Speed', ascending=False)对数据框进行排序。

编辑: 所以你需要这样做:

result = a.groupby(["Id"])['Speed'].median().reset_index().sort_values('Speed')

在 sns.barplot 中添加 order 参数:

sns.barplot(x='Id', y="Speed", data=a, palette=colors, order=result['Id'])

输入图像描述


0
一个更简单的方法是在 result Series 上进行排序,并将其索引作为顺序传递。
import seaborn as sns
import pandas as pd

# aggregate data
df = pd.DataFrame({'Id': [1, 1, 1, 2, 2, 3], 'Speed': [30, 35, 31, 20, 25, 80]})
result = df.groupby('Id')['Speed'].median()

# plot a bar-plot where bars are ordered by median speed
ax = sns.barplot(x=result.index, y=result, order=result.sort_values().index);

img


网页内容由stack overflow 提供, 点击上面的
可以查看英文原文,
原文链接