这是我第一次在这里提问,如果我表达不够清楚请见谅。
到目前为止,我看到了许多关于如何按数据框的某个字段排序条形图的类似问题的答案;但我一直没有找到如何按照 geom_bar 的默认统计量“count”对它们进行排序的方法(显然这不是数据框的一个字段)。 例如,我运行了这段代码:
library(ggplot2)
Name <- c( 'Juan','Michael','Andrea','Charles','Jonás','Juan','Donata','Flavia' )
City <- c('Madrid','New York','Madrid','Liverpool','Madrid','Buenos Aires','Rome','Liverpool')
City.Id <- c(1,2,1,3,1,4,5,3)
df = data.frame( Name,City,City.Id )
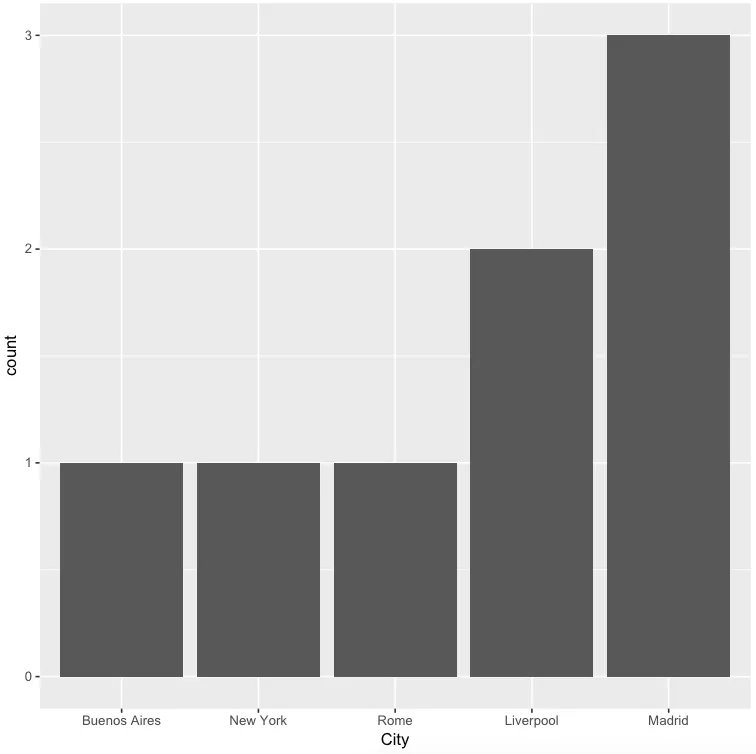
a <- ggplot( df,aes( x = City, text=paste("City.Id=",City.Id)) ) +
geom_bar()
ggplotly(a)
然后我想通过高度(=计数)对结果条形图进行可视化。请注意,我必须保留“City.Id”信息以在最终图中显示。如何实现?
ggplot(df, aes(x=reorder(City, City.Id, length))) + geom_bar()。 - eipi10